OBESITY occurs when an individual accumulates an excess of body fat. The condition is linked to a number of health problems – including cardiovascular diseases, type II diabetes and diabetic kidney disease – and afflicts over 650 million adults worldwide (~13% of the population). The incidence of obesity is rising so rapidly that many scientists and healthcare workers consider obesity to be a pandemic.

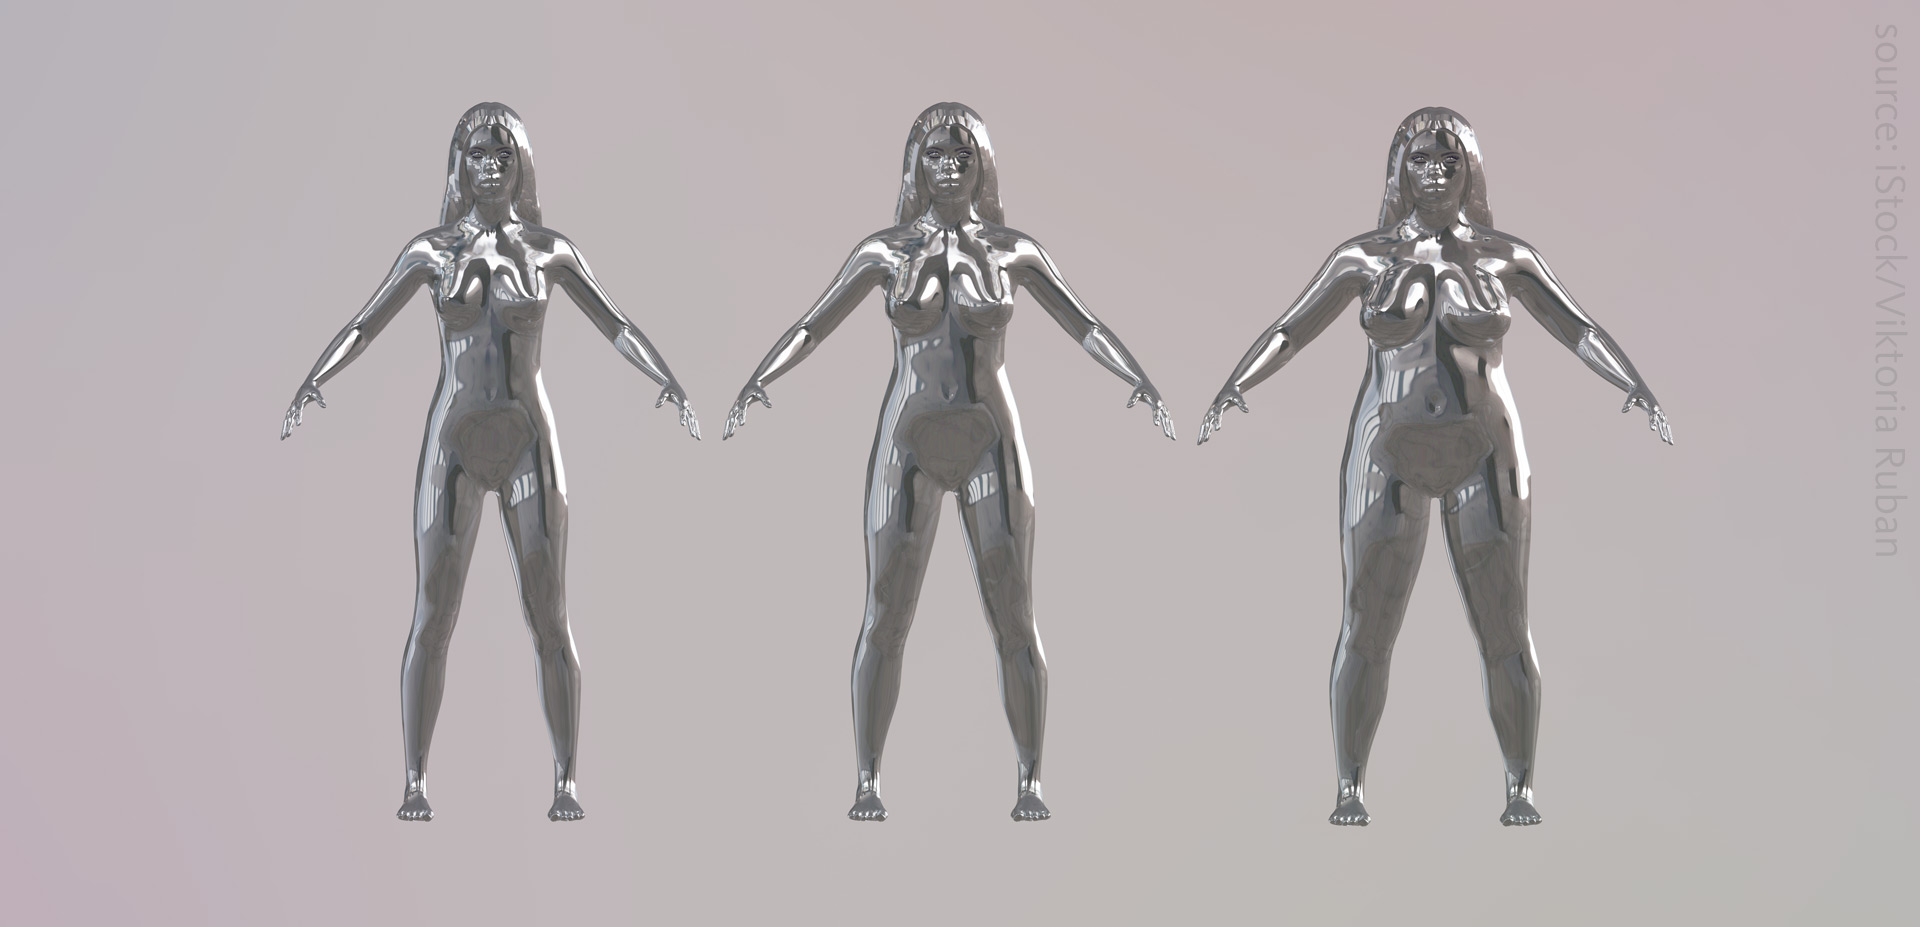
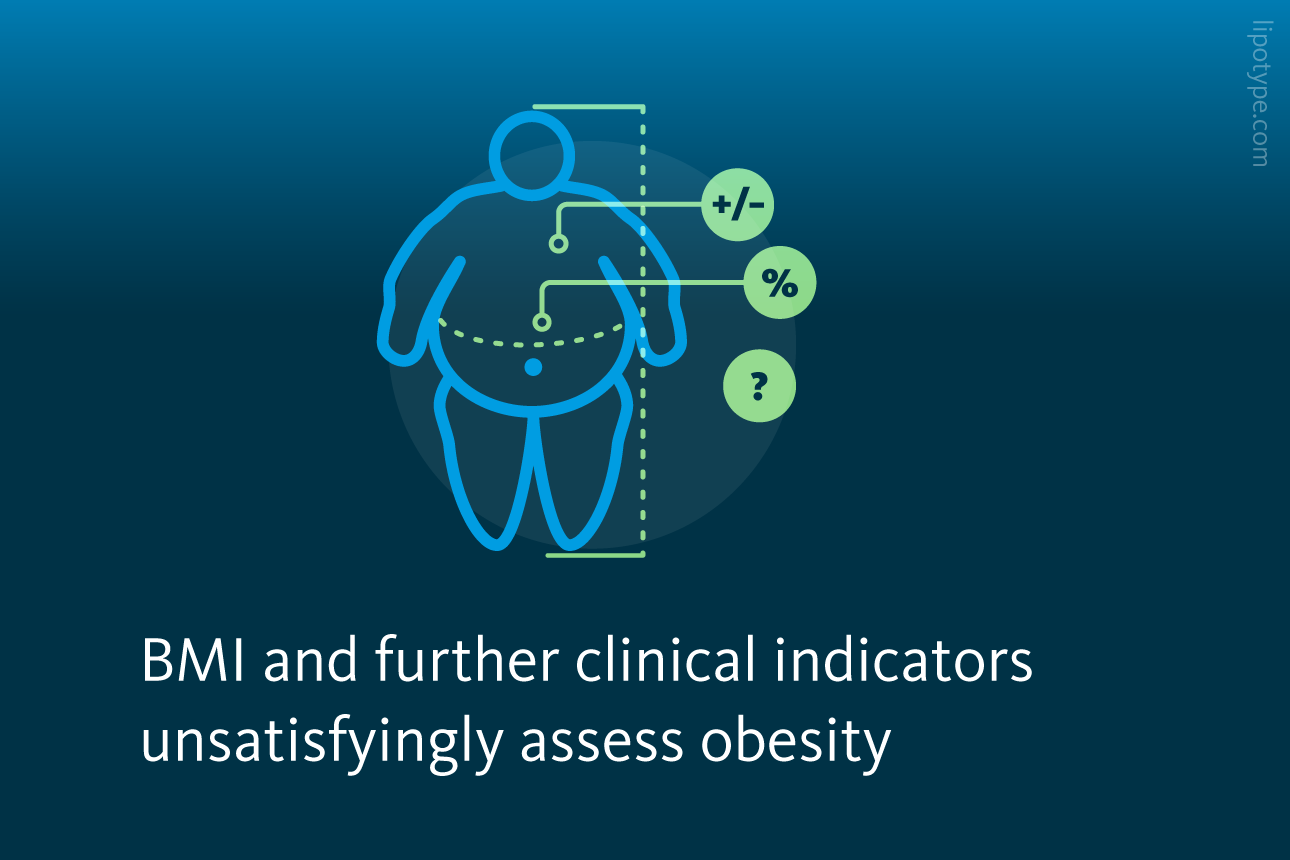
To diagnose obesity, clinicians and researchers estimate body fat using a series of indicators. The most common metric is body mass index (BMI) – a ratio of a person’s weight to their height. Waist circumference and waist-hip ratio are similarly accessible. A more sophisticated metric, body fat percentage, reports on the distribution of adipose tissue and is calculated from the resistance of an electrical field passing through the body.
Unfortunately, these standard indicators struggle to accurately classify individuals by obesity status. They do not account for known heterogeneity in body fat with age, sex, and ethnicity. With the exception of body fat percentage, which is difficult to measure, they also cannot report on body fat distribution, a factor that affects long-term health outcomes. Moreover, the indicators often fail to discriminate between lean muscle mass and body fat; only the latter is linked to obesity.
, obesity (30 ≤ BMI < 35), and extreme obesity (35 ≤ BMI < 40) among men and women aged 20-74 in the United States from 1960-1962 through 2017-2018.")
US overweight and obesity prevalence: Trends in adult overweight (light blue), obesity (green), and extreme obesity (dark blue) among men (straight line) and women (dotted line) aged 20-74 in the United States from 1960-1962 through 2017-2018.
National Health Examination Survey and National Health and Nutrition Examination Surveys, National Center for Health Statistics USA (2020), cdc.gov
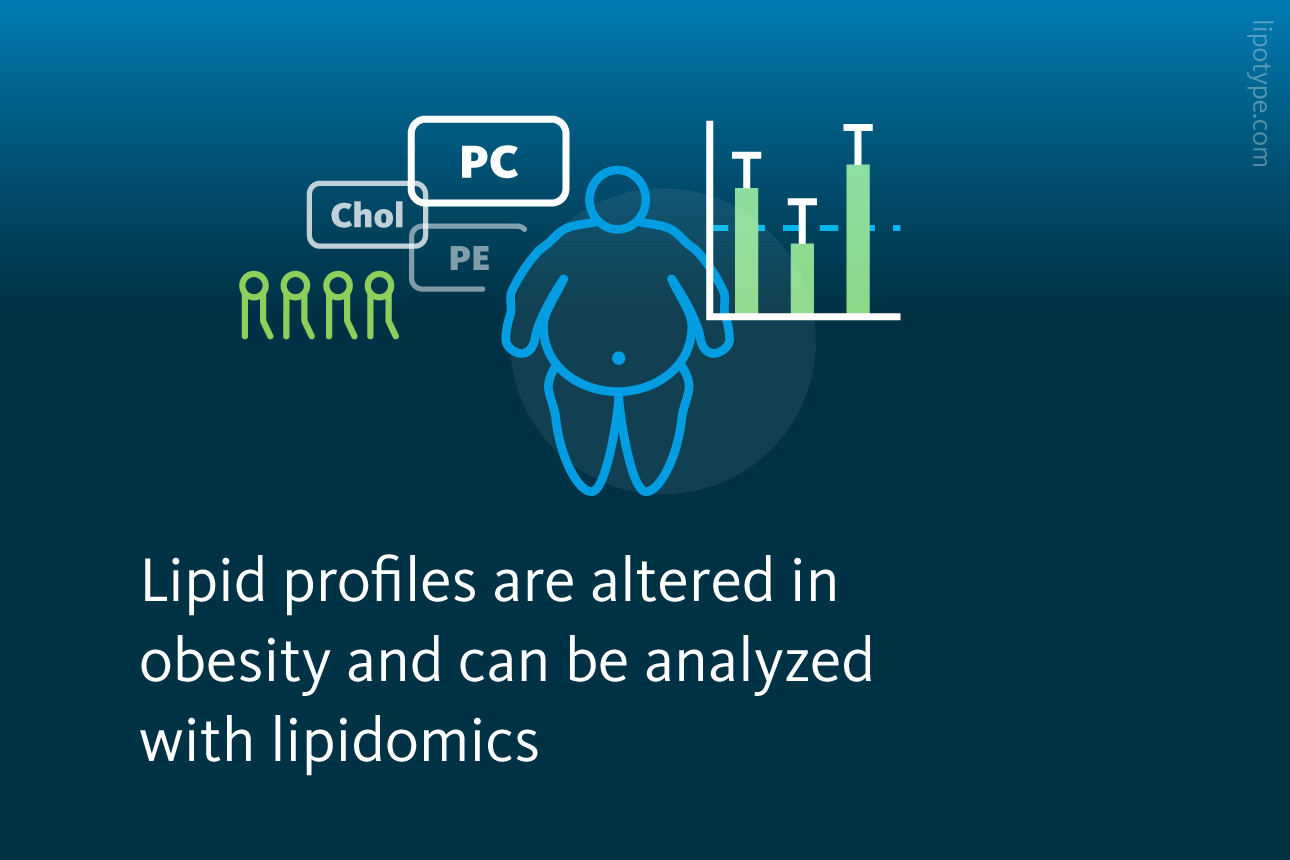
Recent research suggests that molecular measures of metabolism – for example, of cholesterol or metabolomics in the plasma – may classify obesity status more accurately than standard indicators. Additionally, lipid profiles in the body may detect, predict, and/or stratify patients with other diseases. This has been applied to identify new risk factors for cardiovascular disease, diabetes, and biomarkers for multiple sclerosis.
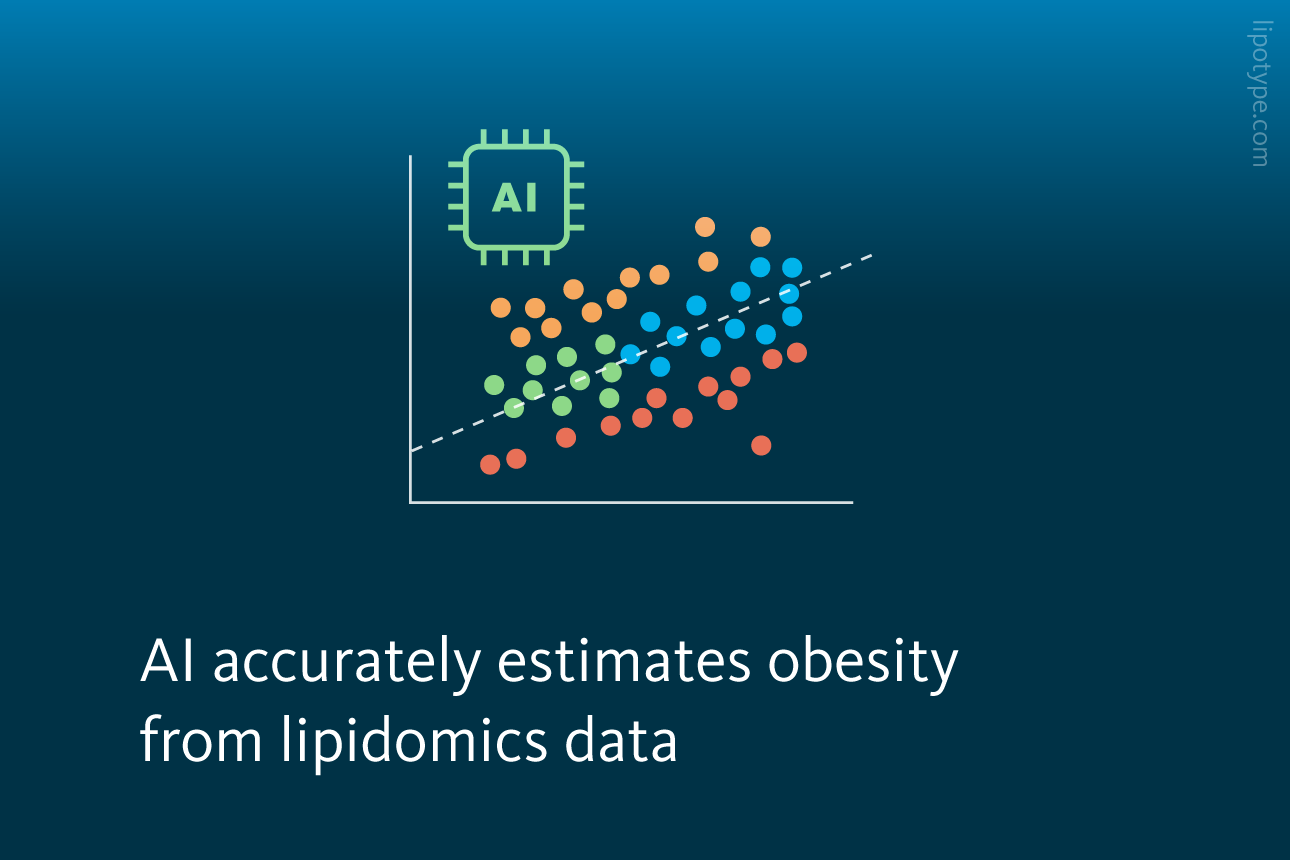
Inspired by these observations and the challenges presented by the obesity pandemic, a collaborative study from researchers of Lipotype, Lund University, Malmö, and the National Institute for Health and Welfare, Helsinki used shotgun lipidomics and machine learning to explore the lipidome of blood plasma samples from two large population cohorts.
 of different obesity measures based on Lasso regression of molar lipid amount data. Only subjects were used, for which all four obesity measures were available: body fat percentage (BFP), waist-hip ratio (WHR), waist circumference (WC), and BMI.")
Regression of obesity measures by lipidome, age, and sex: The NMAE (mean average error divided by the range from the 5th to 95th percentile) of different obesity measures based on Lasso regression of molar lipid amount data. Only subjects were used, for which all four obesity measures were available: body fat percentage (BFP), waist-hip ratio (WHR), waist circumference (WC), and BMI.
Gerl et al., PBio (2019), doi: 10.1371/journal.pbio.3000443
First, shotgun mass spectrometry was used to characterize the plasma lipidome of 1,061 samples from the 2012 National FINRISK Study. Next, these data were used to train a series of machine learning models to estimate indicators of obesity. Then, the best-fit machine learning model was validated on a second plasma lipidome dataset, which was composed of 250 samples from the 2014 Malmö Diet and Cancer Cardiovascular Cohort.
Among the four standard indicators of obesity considered, the best-fit machine learning model predicts body fat percentage most accurately, followed by waist-hip ratio and waist circumference. The model produces an inaccurate estimate of BMI. These results demonstrate that the plasma lipidome contains information about the distribution of adipose tissue in the body, a feature that correlates with obesity-related health outcomes more closely than standard BMI. Interestingly enough, another study described the differences in lipidome profiles of metabolically healthy and metabolically unhealthy patients with obesity.
 and their 95% confidence intervals for each sex (male and female) and adjusted for subject age are shown for lipid subspecies. Correlations with p < 0.05 are shown with filled points, whereas correlations with p > 0.05 are shown transparently. Significant differences between male and female correlations are indicated by an asterisk (*).")
Correlation of lipid subspecies with body fat percentage: Spearman correlation coefficients (ρ) and their 95% confidence intervals for each sex (male and female) and adjusted for subject age are shown for lipid subspecies. Correlations with p < 0.05 are shown with filled points, whereas correlations with p > 0.05 are shown transparently. Significant differences between male and female correlations are indicated by asterisks.
Gerl et al., PBio (2019), doi: 10.1371/journal.pbio.3000443
Several triglyceride lipid species correlated positively with body fat percentage, whereas ether phospholipids such as ether-linked phosphatidylcholines correlated negatively. The study further confirmed previous research suggesting a key role for the sphingolipid class sphingomyelin in obesity.
It was not possible to identify a single or small set of biomarkers for obesity. However, the best-fit model’s accuracy increased with the inclusion of more data (i.e., lipid class and abundance, age, and sex). These results demonstrate that a complex, multi-dimensional model is necessary to estimate obesity status from plasma lipidome data.
 based on lipidomes of the training set are shown on the y-axis. Modeling was either done without age and sex as covariables or with. Variables in addition to the lipidome are shown on the x-axis: “A” no additional input; “B” routine clinical laboratory variables such as HDL/LDL cholesterol; “C” additional variables such as prevalent diseases; “B + C” the combination of clinical and additional variables.")
Improvement of model accuracy by the inclusion of further data: R2 cross-validation mean and standard deviation (n = 50) based on lipidomes of the training set are shown on the y-axis. Modeling was either done without age and sex as covariables or with. Variables in addition to the lipidome are shown on the x-axis: “A” no additional input; “B” routine clinical laboratory variables such as HDL/LDL cholesterol; “C” additional variables such as prevalent diseases; “B + C” the combination of clinical and additional variables.
Gerl et al., PBio (2019), doi: 10.1371/journal.pbio.3000443
The Malmö Diet and Cancer Cardiovascular Cohort study took place in a different country than and two years after the FINRISK study; additionally, individuals fasted overnight and 4 hours, respectively. Despite these discrepancies, the best-fit model’s performance was not significantly different in the second dataset. The model is both robust and reproducible.
Further, this study shows that the plasma lipidome can reveal features of obesity inaccessible by existing indicators. For example, in 1 in 7 patients, the lipid metabolism data-based algorithm provided more information about obesity compared to BMI measurement, such as the amount of visceral body fat, and classified obesity status more accurately. Thus, the model may improve the identification of patients in need for weight reducing therapy who do not qualify by BMI.
 or upper (orange) 15% of the residual distribution. Non-outliers are colored as Normal (BMI < 25), or Overweight (25 ≥ BMI < 30). Because samples classified as \"pred < obs\" and \"pred > obs\" are not evenly distributed along the axis, the analysis is restricted to observed BMI 21.4 to 29.73.")
Comparison of model-predicted BMI and observed BMI: The diagonal line represents a predicted BMI matching the observed BMI. Outliers are defined as the lower (purple) or upper (orange) 15% of the residual distribution. Non-outliers are colored as Normal (BMI < 25), or Overweight (25 ≥ BMI < 30). Because samples classified as “pred < obs” and “pred > obs” are not evenly distributed along the axis, the analysis is restricted to observed BMI 21.4 to 29.73.
Gerl et al., PBio (2019), doi: 10.1371/journal.pbio.3000443
The lipidomics data-based model may be applied successfully as an indicator of obesity in clinical research and routine clinical care.
Despite the rising incidence of obesity, indicators to diagnose the condition remain imprecise. Metabolism, which is altered in obese individuals, may provide more reliable indicators of obesity. Indeed, changes in metabolism can be observed through molecular omics analyses, including lipidomics. Further research will characterize the precise molecular relationships between metabolism and obesity.
Through characterization of the plasma lipidome, Lipotype Lipidomics technology can identify changes in a person’s metabolism. These metabolic indicators may be useful for diagnosing or predicting certain conditions, like metabolic syndrome, and diseases, including obesity, but also monitoring therapeutic success, as in anorexia refeeding therapy.
Not sure how this works for your case?
Let’s talk it through!

Lipotype products are provided for Research Use Only. They are not intended for clinical diagnostic purposes and must not be used to inform medical treatment decisions. The content of this article is for scientific and educational purposes only and should not be considered medical advice.