
by Dr. Sarai Valerio Cabrera
OBESITY is a medical condition characterized by the excessive accumulation of body fat, typically defined as having a body mass index (BMI) equal to or greater than 30 kg/m². It is well-established that obesity is a significant risk factor for the development of numerous pathologies, including cardiovascular diseases (CVD) and metabolic disorders such as type 2 diabetes (T2D), and non-alcoholic fatty liver disease. Overall obesity is associated with a reduction in the quality of life.
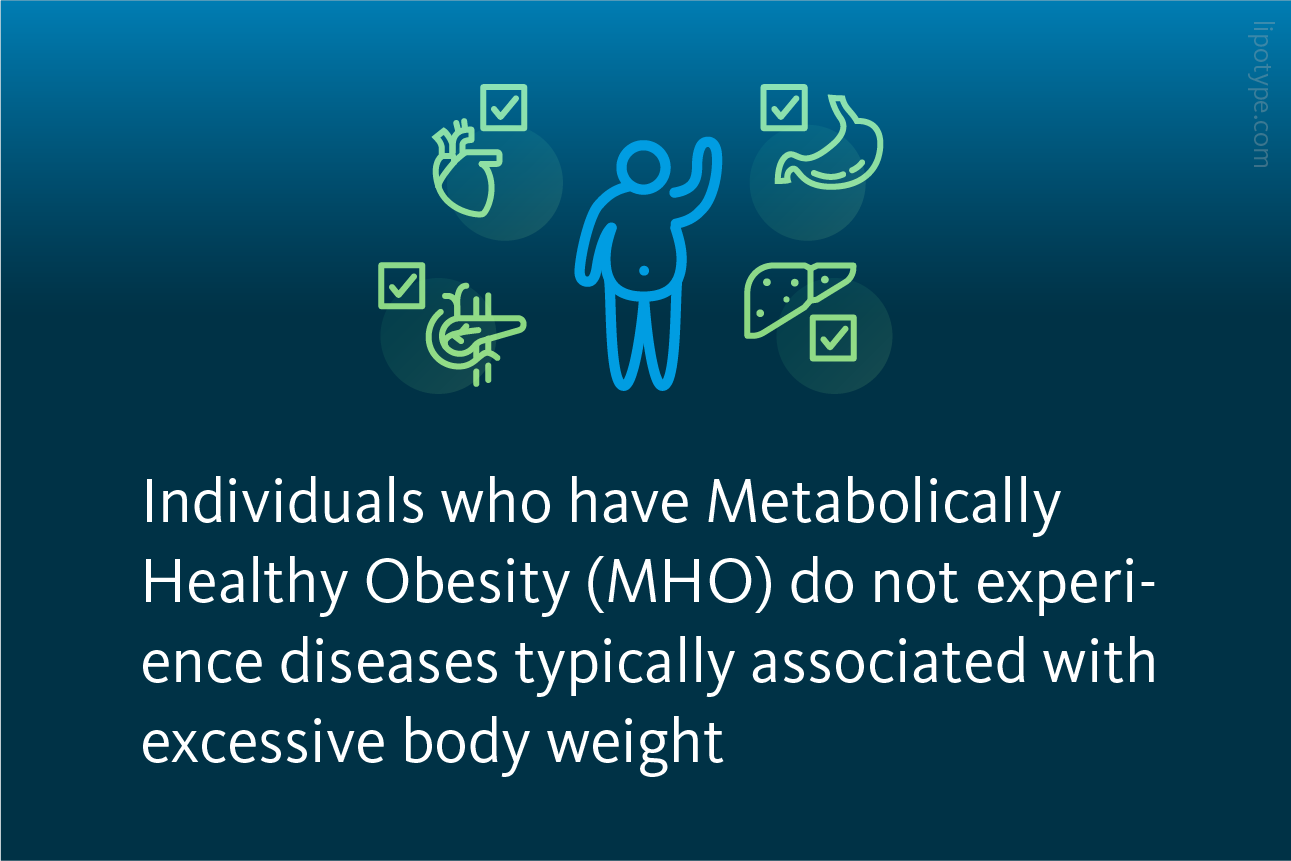
Nonetheless, some obese individuals appear to avoid developing obesity-related diseases. This phenomenon, known as Metabolically Healthy Obesity (MHO), has sparked a debate about the complex factors involved in the effects of excess body weight on health. Given that obesity can be considered a global pandemic, there is great interest in understanding MHO to improve and personalize the treatment and care of obese individuals
 were obtained from plasma samples, and data were analyzed using Principal Component Analysis (PCA), Logistic regression models and correlation tests.")
Study design. 3,443 individuals were classified into 3 categories based on their weight and health history. Profiles for three biomarkers (metabolites, lipids, and proteins) were obtained from plasma samples, and data were analyzed using Principal Component Analysis (PCA), logistic regression models and correlation tests
Korduner et al., Hindawi Journal of Obesity (2021), 10.1155/2021/6616983
With this in mind, Korduner and Ottoson aimed to characterize the metabolic and lipid biomarkers associated with metabolically healthy obesity. Their group had previously reported that a sedentary lifestyle and higher levels of blood glucose and lipids, combined with adverse lower socioeconomic conditions, contribute to developing metabolically unhealthy obesity (MUO). This time, the multiomics analysis of human blood plasma was performed. The authors compared plasma levels of metabolites and lipids (metabolomics and lipidomics) and circulating proteins (proteomics) between MHO individuals, MUO patients, and nonobese controls (NOC).
This populational study comprised 3,443 individuals selected from the Malmö Diet and Cancer Study (MDCS) for the epidemiology of carotid artery disease, that results from a blockage or narrowing of the carotid arteries. Among these individuals, 143 were classified as the Metabolically Healthy Obesity (MHO) group based on a BMI ≥ 30 kg/m2 and no prior hospitalization for somatic disease, while 273 were classified as the Metabolically Unhealthy Obesity (MUO) group due to at least one hospitalization record. The remaining 3,027 individuals were Non-Obese Controls (NOC). Lipid profiling of blood plasma was performed using high-throughput shotgun lipidomics platform.
 MUO and b) NOC subjects. The log odds ratio (logOR) is used to measure the strength and direction of the association between a predictor and an outcome; A positive logOR indicates a positive association, meaning that as the predictor variable increases, the odds of the outcome variable increase, and vice versa. pm1-5: metabolite principal components, pp1-5: protein principal components, and pl1-5: lipid principal components, where the number indicates the principal component’s number.")
Associations between the principal components and MHO. Logistic regression models of the main principal components when comparing MHO with a) MUO and b) NOC subjects. The log odds ratio (logOR) is used to measure the strength and direction of the association between a predictor and an outcome; A positive logOR indicates a positive association, meaning that as the predictor variable increases, the odds of the outcome variable increase, and vice versa. pm1-5: metabolite principal components, pp1-5: protein principal components, and pl1-5: lipid principal components, where the number indicates the principal component’s number.
Korduner et al., Hindawi Journal of Obesity (2021), 10.1155/2021/6616983
The study analyzed biomarker data using principal component analysis (PCA), which is a statistical technique used to reduce the dimensionality of a dataset consisting of many variables. PCA identifies a set of new variables, called principal components, which are linear combinations of the original variables (plasma levels of metabolites, lipids, and circulating proteins). Thus, each principal component captures a portion of the total variation in the dataset, with the first principal component accounting for the most variation, followed by the second principal component, and so on.
The second lipid principal component (PL2) and the fifth protein principal component (PP5) were associated with MHO when compared to MUO. Furthermore, when comparing the main loadings for PL2, the authors found that it was dominated by positive contributions sphingomyelins and phosphatidylcholine ethers and negative contributions from triacylglycerols and diacylglycerols, although the exact role of these lipid groups in maintaining a metabolically healthy obesity state remains to be explained. Furthermore, PL2 was correlated with traditional cardiometabolic risk factors, showing that PL2 has a strong inverse correlation with plasma triglycerides, insulin resistance, and glucose, and a strong positive correlation with HDL (high-density lipoprotein) cholesterol. Interestingly enough, sphingolipids play a role in obesity development.
 represent the contribution of each lipid to the principal component (PL2), showing the lipids that account the most for the differences between the lipid profiles of MHO and MUO. On the left are the Lipid identifiers. PC: Phosphatidylcholine, TAG: Triacylglycerol, SM: Sphingomyelin, DAG: Diacylglycerol.")
Main loadings for PL2, when comparing MHO with MUO. Loadings (bars) represent the contribution of each lipid to the principal component (PL2), showing the lipids that account the most for the differences between the lipid profiles of MHO and MUO. On the left are the Lipid identifiers. PC: Phosphatidylcholine, TAG: Triacylglycerol, SM: Sphingomyelin, DAG: Diacylglycerol.
Korduner et al., Hindawi Journal of Obesity (2021), 10.1155/2021/6616983
The researchers also compared both PL2 and PP5 of MHO and MUO through a model for metabolic syndrome (MetS). The model combined data from systolic blood pressure, waist circumference, and fasting plasma levels of glucose, cholesterol, and triglycerides. A multiple regression analysis was performed and found no significant differences between PL2 and PP5. Accordingly, obese individuals from both groups showed elevated systolic blood pressure, increased waist circumference, high plasma levels of both glucose and triglycerides, and low levels of HDL cholesterol. These results suggest that there could be a link between healthy and unhealthy obesity states partially explained by MetS.
When PCA of the three different biomarker layers was used to describe the biomarker variation of the healthy study participants (that is MHO and NCO), larger differences in the biomarker pattern were observed (three protein, two lipid, and two metabolite principal components), meaning that a healthy obesity profile is closer to an unhealthy state than to the nonobese baseline. Furthermore, PL2 is again the lipid principal component with the largest difference between MHO and NCO, with higher negative contributions from triacylglycerides and positive contributions from phosphatidylcholine ethers. This suggests that these two lipid groups have the potential to be used as predictors of the metabolic health of obese patients.

Correlation between PCs and cardiometabolic risk factors. Partial Spearman’s correlation tests were used to examine the correlations of PL2 and PP5 with cardiometabolic risk factors while adjusting for age and sex. Note that PL2 and PP5 were significantly associated with MHO. SBP: systolic blood pressure, TG: Triglycerides, AHT: antihypertensive treatment, BMI: body mass index, CRP: C-reactive protein, DBP: diastolic blood pressure, HbA1c: glycated hemoglobin; HOMA-IR: homeostatic model assessment for insulin resistance, LDL: Low-density lipoprotein, neg, negative; pos, positive.
Korduner et al., Hindawi Journal of Obesity (2021), 10.1155/2021/6616983
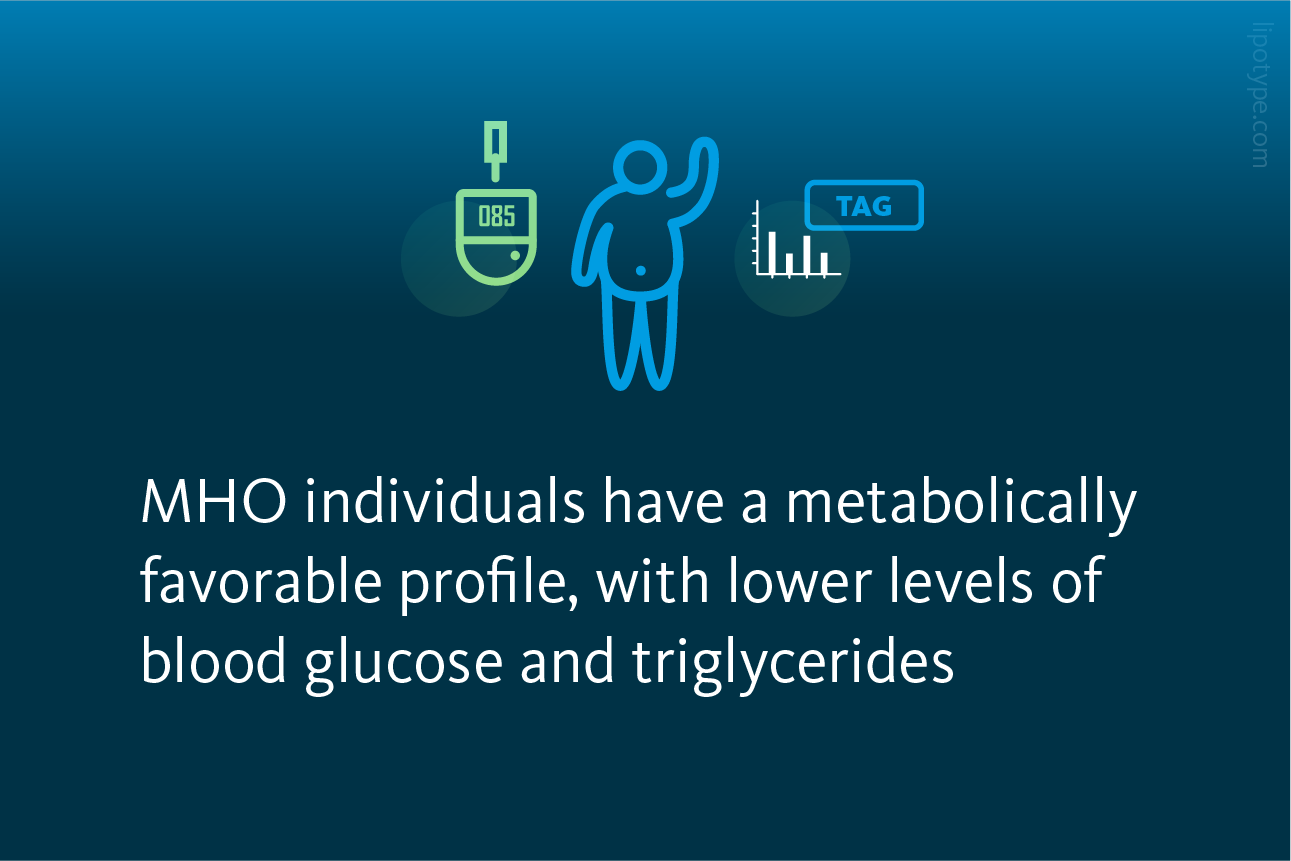
The pattern of key biomarkers suggests that MHO individuals have a metabolically favorable profile, meaning lower levels of blood glucose and triglycerides, accompanied by lower levels of metabolically unfavorable lipid biomarkers and lower potentially harmful proteomic biomarkers when compared to MUO. Despite these findings, when MHO individuals were compared to NOC, the data showed larger biomarker differences and obesity-related parameters such as elevated systolic blood pressure, increased waist circumference, high plasma levels of both glucose and triglycerides, and low levels of HDL cholesterol.
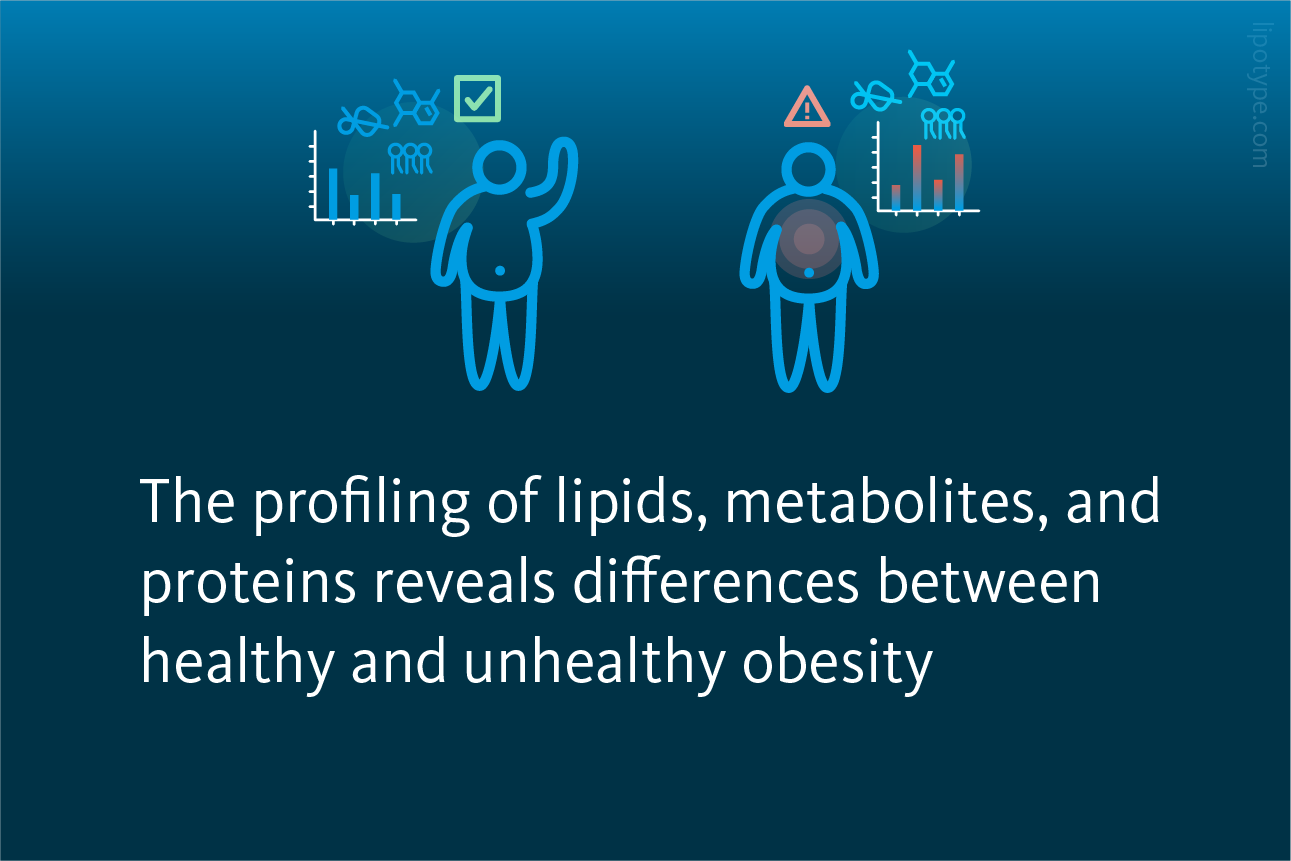
This study presented a unique and extensive profiling of lipids, metabolites, and proteins in order to identify differences between healthy and unhealthy obesity. Such an approach can be utilized to differentiate other metabolism-related diseases and improve their prediction and treatment options.


Lipotype Lipidomics technology can be used to obtain the lipid profile of plasma samples to characterize the metabolic state of individuals in cases like metabolic syndrome, for both research and to identify patients with a higher risk of future hospitalization.
Do you have any questions?
We can answer them!

Lipotype products are provided for Research Use Only. They are not intended for clinical diagnostic purposes and must not be used to inform medical treatment decisions. The content of this article is for scientific and educational purposes only and should not be considered medical advice.