

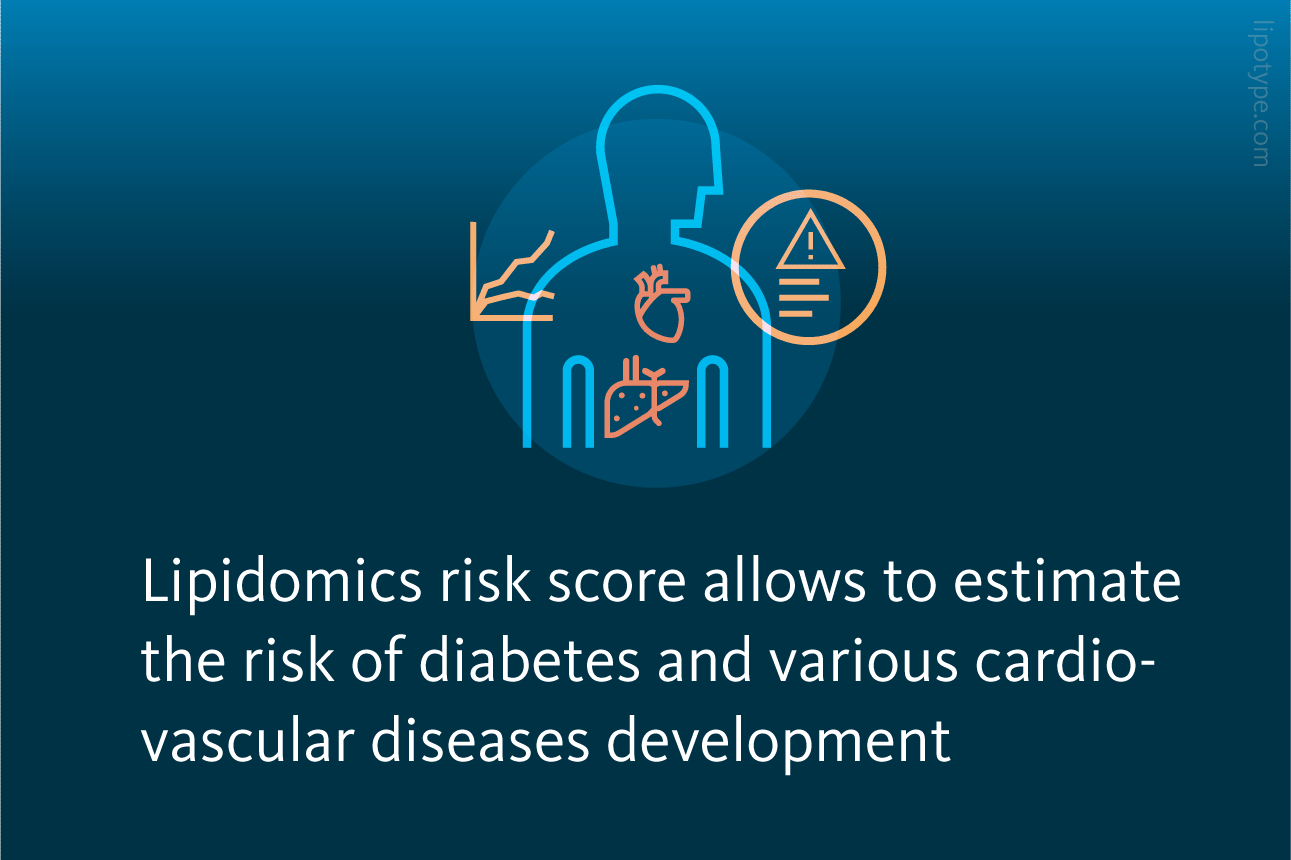
EARLY and accurate identification of individuals at high risk for type 2 diabetes (T2D), cardiovascular disease (CVD), and metabolic syndrome is crucial for effective disease prevention and management. By detecting risk factors at an early stage, individuals can make changes to their lifestyle, such as adjusting their diet and increasing physical activity, to lower their risk of developing these diseases. In addition, early risk identification also enables healthcare providers to monitor individuals more closely and offer appropriate interventions and treatments, if necessary. The timely detection of T2D and CVD risk is essential for reducing the disease burden and improving public health outcomes.
Proper T2D and CVD risk detection, measurement, and evaluation require a multi-disciplinary approach that considers the various risk factors and the individual’s unique circumstances and needs. Lauber and Simons suggest that a combination of genetic background, lipidomic profile alterations, and clinical risk factors provides a more accurate assessment of future T2D and CVD risk, compared to relying on classical risk factors alone.

Study design. Genomic and lipidomic analyses of blood plasma samples from 4067 participants were performed. The risk of type 2 diabetes and cardiovascular disease development was assessed based on the data obtained from blood plasma analysis and clinical and vital parameters of participants.
Lauber et al., PLOS Biology (2022), 10.1371/journal.pbio.3001561
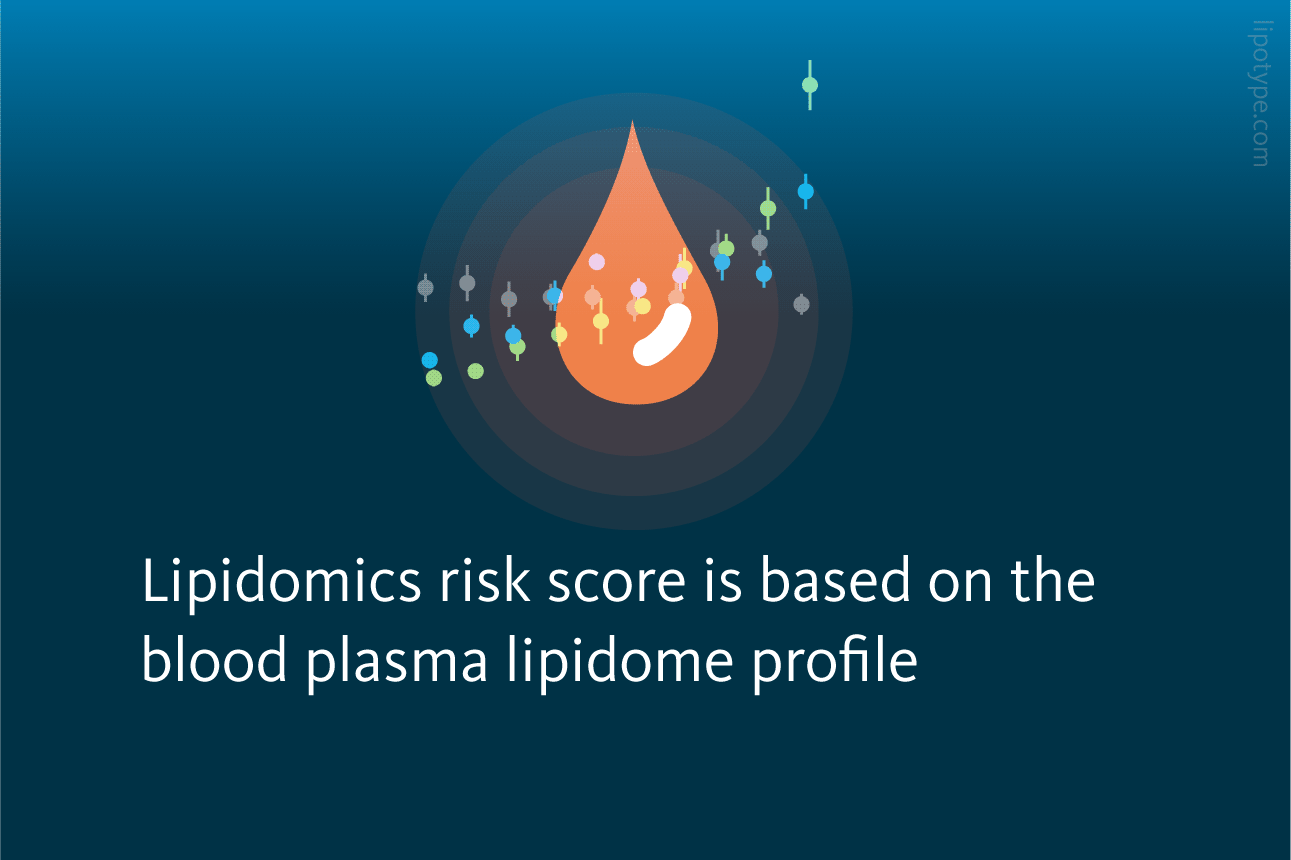
The authors investigated the role of blood plasma lipidome profiles in modulating the risk of T2D and CVD development in the future. Using the shotgun lipidomics technology and comprehensive data analysis tools patients’ blood plasma was analyzed, and in total 184 lipid species were detected, identified, and quantified, and a subsequent lipidomics risk score (L) was suggested. A clear trend of increased lipidomics risk score with increasing incidence of T2D and CVD was detected in all the quantiles, and the most drastic changes were identified in the lowest 0% to 10% and the highest 90% to 100% quantiles. Furthermore, a highly contrasting incidence rate between the lowest and highest lipidomics risk scores (from 3% to 37%) was detected in T2D cases and from 10% to 40.5% in CVD cases. These results indicate that lipids may play a significant role in modulating the risk of these diseases.
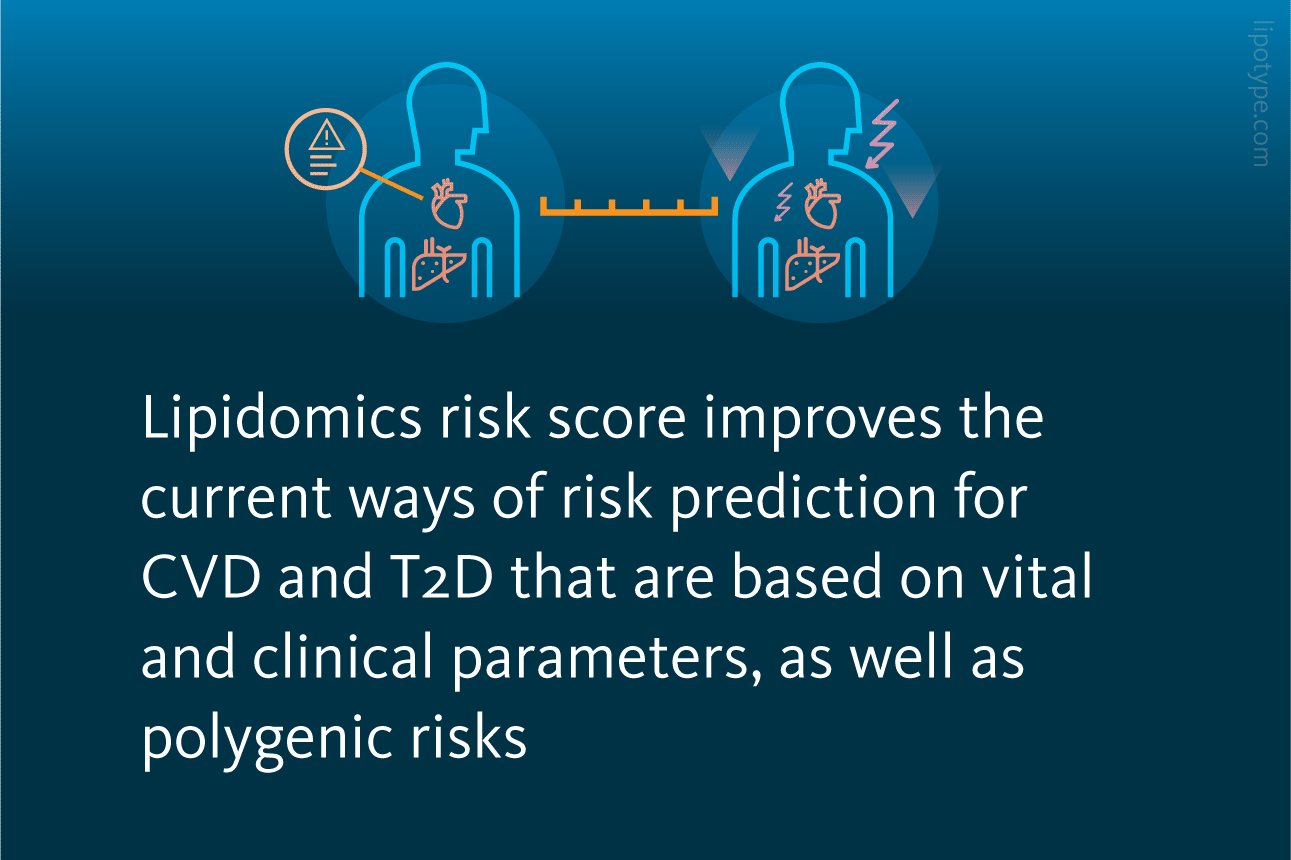
To improve risk stratification, the authors combined the lipidomics risk score with other standard clinical measurements (C), such as BMI, blood pressure, fasting blood glucose, glycated hemoglobin, LDL, HDL, and triglyceride levels, as well as polygenic (P) parameters, and age and sex (N). This combined model (N + L + P + C) improved the risk stratification for these diseases compared to the other scores.
 and CVD (right) case rates are allocated to deciles. Dot represents the mean for 10 repetitions and the bars represent the standard errors. The risk scores are based on the models utilizing the following parameters: age and sex (N), lipidome (L), polygenic score (P), and clinical parameters (C). The combinations of particular variables in the models are N+L+P and N+L+P+C. The dashed line represents the average incidence rate within the cohort. CVD, cardiovascular disease; T2D, type 2 diabetes.")
Risk scores and case rate correlation. Various risk scores for T2D (left) and CVD (right) case rates are allocated to deciles. Dot represents the mean for 10 repetitions and the bars represent the standard errors. The risk scores are based on the models utilizing the following parameters: age and sex (N), lipidome (L), polygenic score (P), and clinical parameters (C). The combinations of particular variables in the models are N+L+P and N+L+P+C. The dashed line represents the average incidence rate within the cohort. CVD, cardiovascular disease; T2D, type 2 diabetes.
Lauber et al., PLOS Biology (2022), 10.1371/journal.pbio.3001561
For T2D, in the highest quartile the case rate was 51%, while for CVD it was 53%, and in the lowest quartile the case rate was 1% and 6,5% respectively. The combined effect size of all lipid species exceeded those of other individual risk predictors for both T2D and CVD (N + L+ P vs N + L + P + C).
The statistical comparisons of lipid concentrations between high-risk and low-risk T2D individuals showed that lipid species with altered concentrations were the following: all triacylglycerols (TAGs) and most diacylglycerols (DAGs) had increased concentrations, as well as sphingomyelins (SMs), while most phosphatidylcholine plasmalogens (PC O-s) showed decreased concentrations in high-risk individuals. For the CVD cohort, the signature of elevated TAGs and DAGs was very similar. Contrary to all elevated sphingomyelin (SM) species trends in the T2D cohort, only a subset of SM species had increased concentrations in the CVD cohort.
 and CVD (right), with the changes being statistically significantly different for the presented lipid classes. CVD, cardiovascular disease; DAG, diacylglyceride; SM, sphingomyelin; T2D, type 2 diabetes.")
Selected features of high-risk lipidome signature. The dots represent the fold-changes of the selected lipid classes concentrations in the individuals of the 90%–100% N + L + P + C risk score quantile compared to the other quantiles for T2D (left) and CVD (right), with the changes being statistically significantly different for the presented lipid classes. CVD, cardiovascular disease; DAG, diacylglyceride; SM, sphingomyelin; T2D, type 2 diabetes.
Lauber et al., PLOS Biology (2022), 10.1371/journal.pbio.3001561
To further investigate the effect of lipidome alterations on CVD and T2D development risk, the authors performed clustering based on the lipidomics data and distinguished six major subgroups, which had different distributions of risk scores. The clusters were then compared to the risk of T2D and CVD, and the group with the highest risk for both was identified.
While the highest-risk subgroup did not have any drastic differences from other groups in terms of the vital and clinical parameters, this group showed a striking lipidome signature. The concentrations of nine lipid classes, including cholesterol, certain lysolipids, and others, were significantly altered while regular and ether-linked phosphatidylcholines, DAG, and TAG did not show significant changes compared to other groups.

T2D and CVD risk subgroups based on lipidome profiles. A hierarchical clustering based on 184 lipid concentrations with Pearson correlation used as distance measure. The high-risk group is colored. CVD, cardiovascular disease; T2D, type 2 diabetes.
Lauber et al., PLOS Biology (2022), 10.1371/journal.pbio.3001561
The study highlights the potential importance of lipidome in predicting disease risk, and the possibility of using lipidomic risk scores for early disease risk assessment for both T2D and CVD. The results of this population health cohort study suggest that measuring the lipidome regularly over time could help to monitor a person’s health status and understand how lifestyle and diet can impact their health. By identifying lipidomic alterations early on, it may be possible to intervene and prevent the onset or progression of a disease, or to adjust lifestyle or dietary habits to reduce the risk of developing a disease in the future. This could be especially important in the early stages of a person’s life when risk assessment is critical for disease prevention and early intervention.
Lipotype Lipidomics technology can be used to characterize the blood plasma lipidomes in order to assess the risk of different disease development, such as T2D, metabolic obesity, heart failure or the differential diagnosis of particular CVD and inflammatory diseases.
Not sure how this works for your case?
Let’s talk it through!

Lipotype products are provided for Research Use Only. They are not intended for clinical diagnostic purposes and must not be used to inform medical treatment decisions. The content of this article is for scientific and educational purposes only and should not be considered medical advice.