Lipidomics Data Analysis
Our different lipidomics data analysis reports will help you understand and interpret complex lipidomics data sets.
Acquiring Lipidomics Data

From fatty acyls to phospholipids, sphingolipids & more
Our mass spectrometry-based lipidomics technology identifies and quantifies more than 4200 individual lipids. The acquired lipid data is then incorporated into your detailed lipidomics data analysis reports.
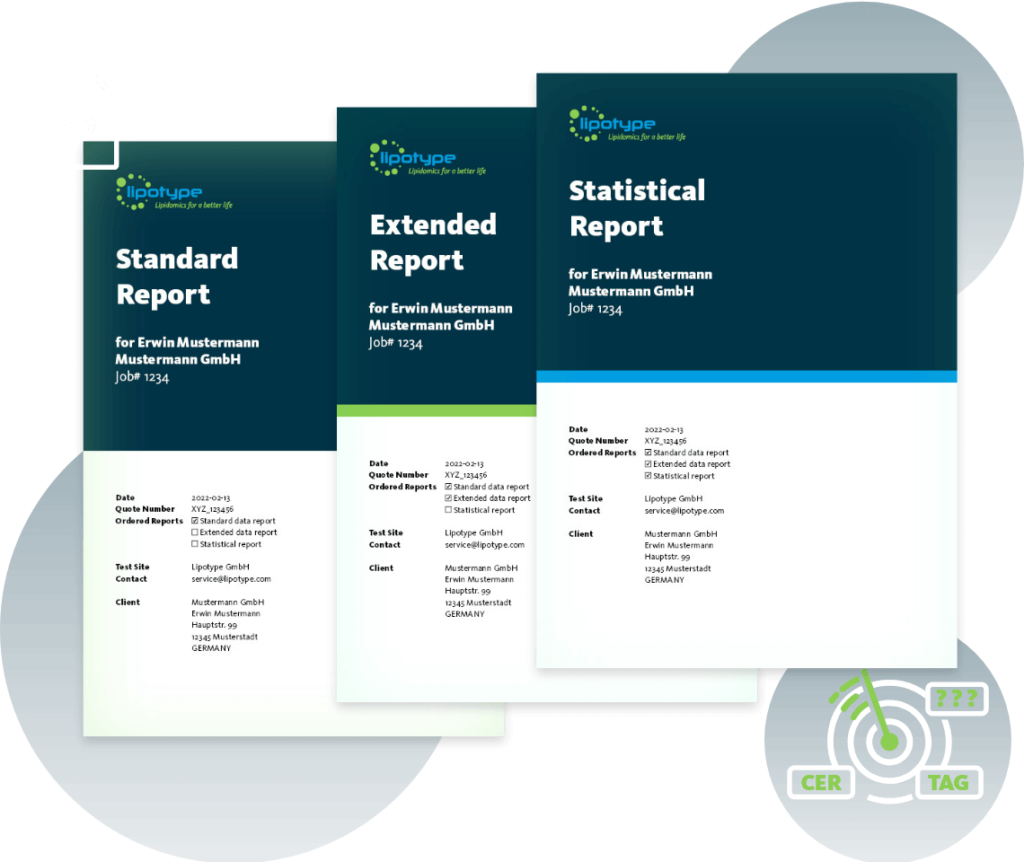
Standard Report
Level 1 – Discovering Data
The Standard Data Report provides you access to the big picture of your lipidomics results. It contains your analysis data (pmol and mol% data for every sample) and all further information that you require to dive into the details of your lipidomics data analysis.
Further, the Standard Data Reports contains detailed information on methodology and analysis details, such as sample total lipid amounts and technical variation. It does not only answer the question ‘what was done with my samples’ but also ‘which quality standards were applied’. Thus, it lets you estimate the quality of your sample preparation and how successful the analysis was.
Features
- Lipid class composition profile
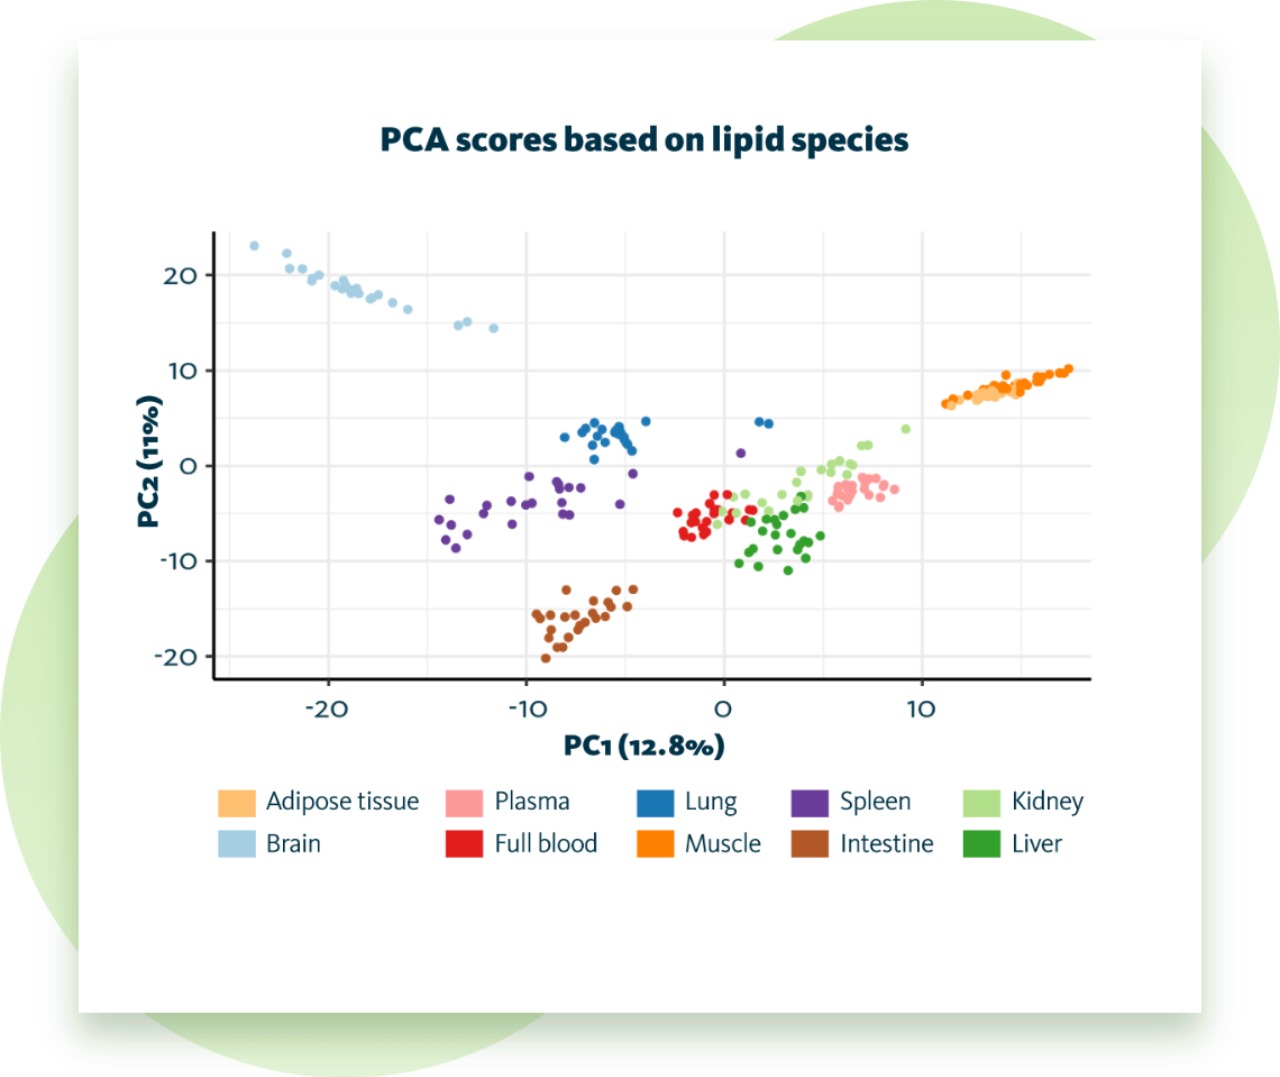
- Standard Principal Component Analysis (PCA)
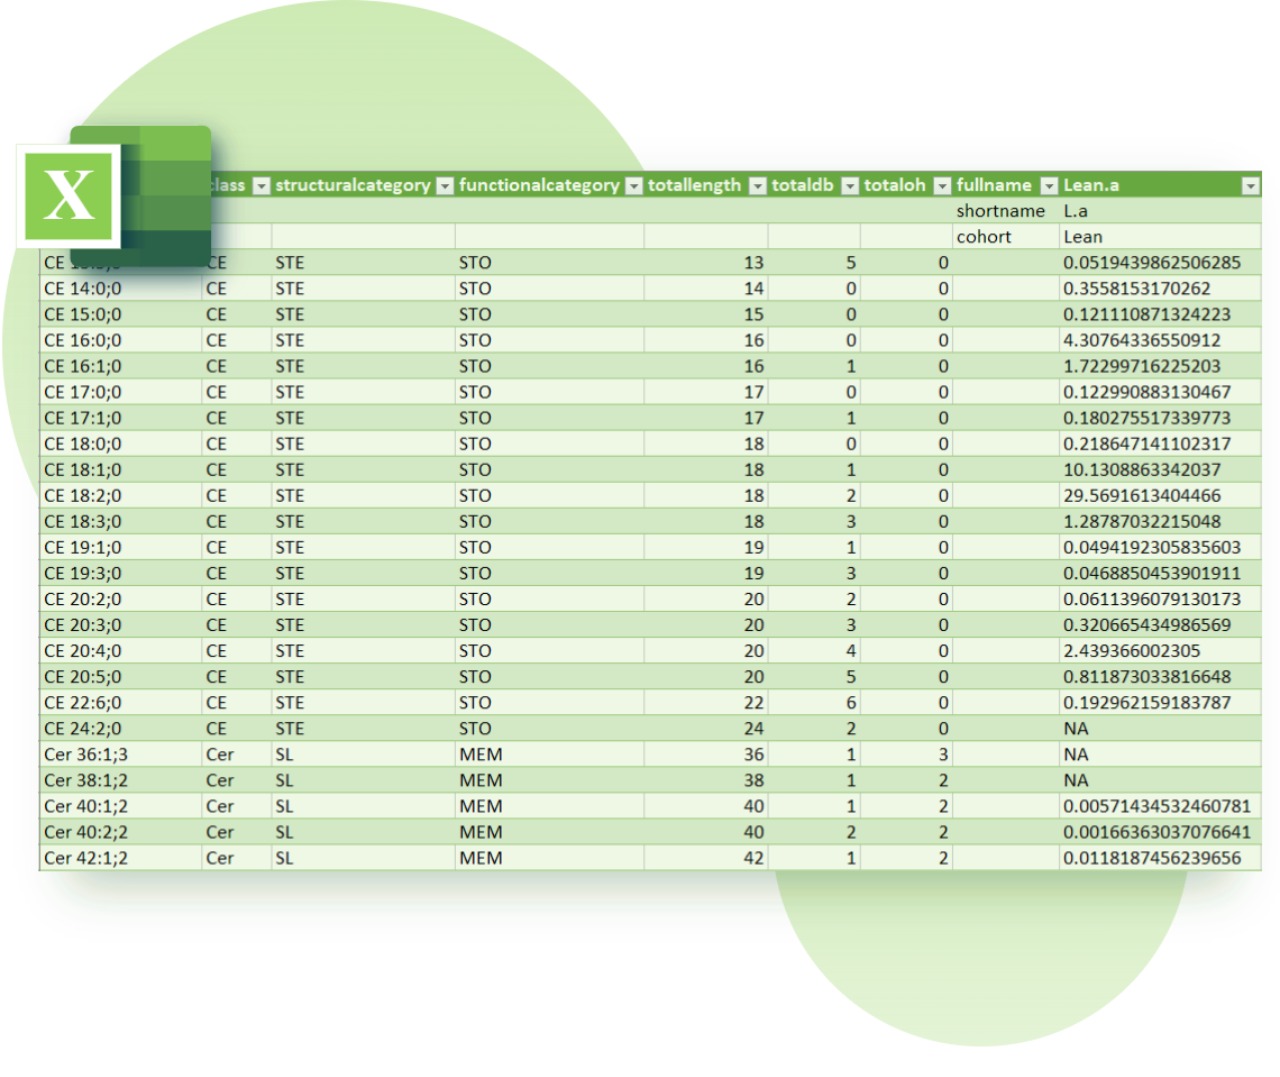
- Quantitative lipidomics results in tabular format


Extended Report
Level 2 – Exposing Trends
The Extended Data Report does the heavy lifting for you. It extends the contents of the standard data report with go-to lipidomics data analyses to support you in understanding your lipidomics results.
Further, the tabular lipidomics results of the Extended Data Report contain an ANOVA test to help you detect significant differences in your lipid data. It aids you to quickly grab what lipidomics data may be more worthwhile to look into.
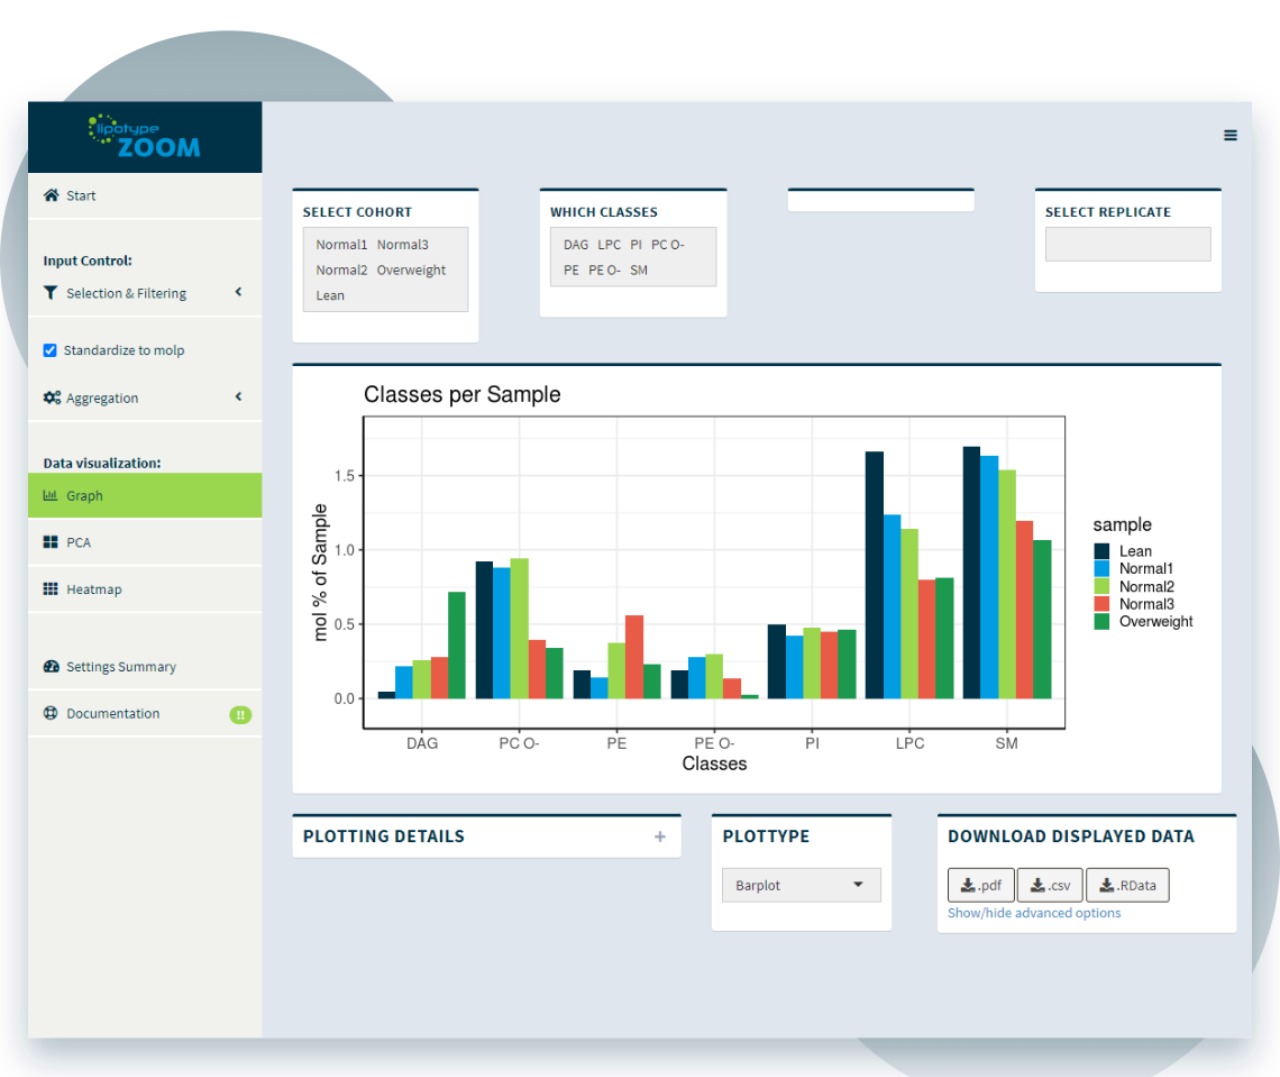
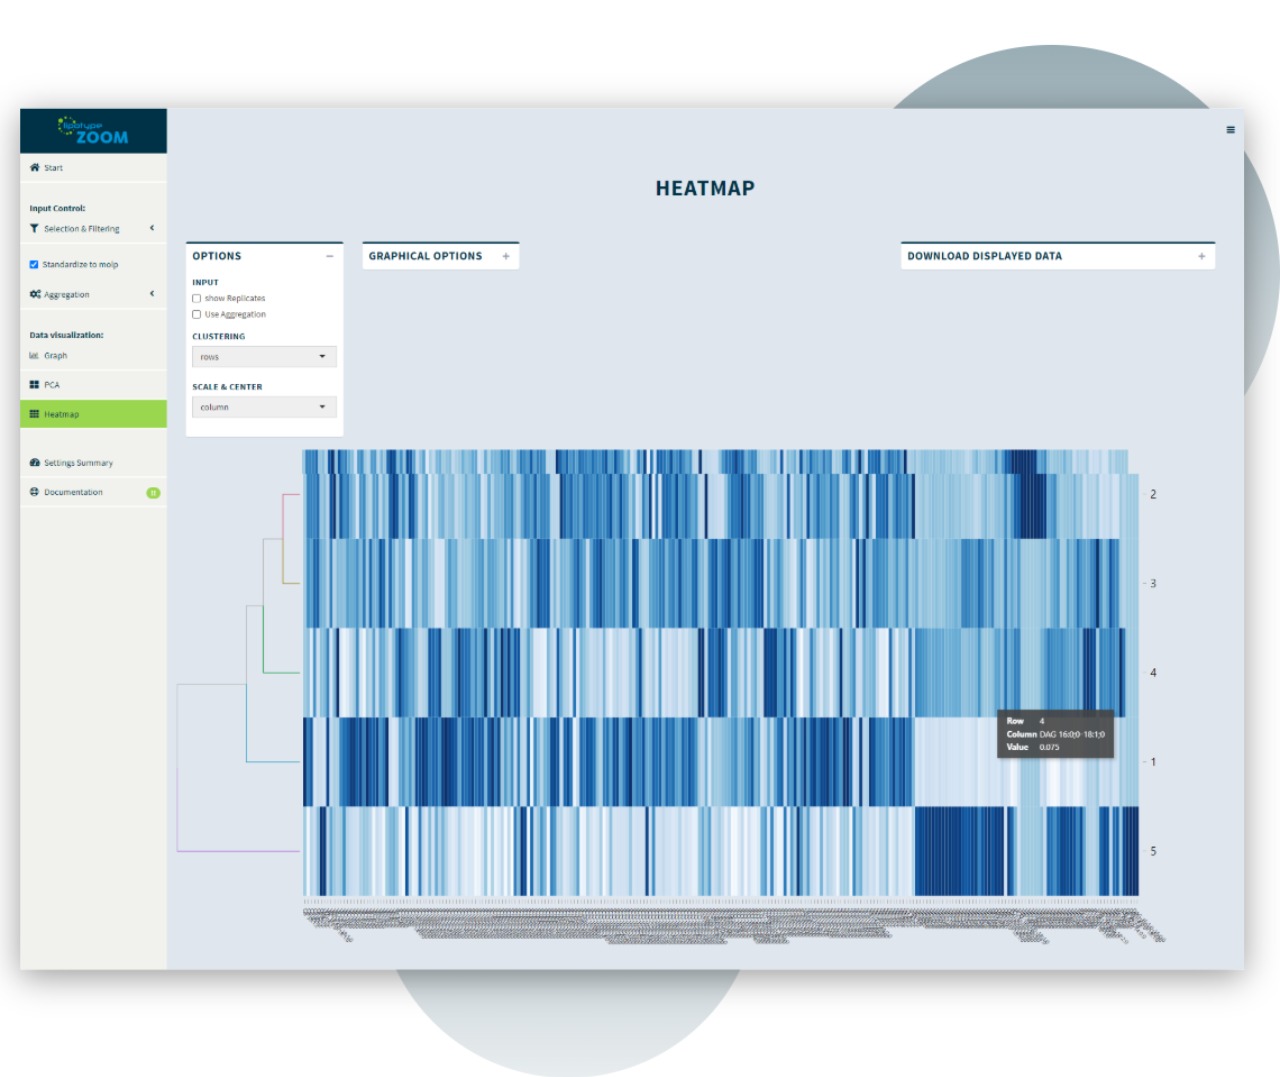
In addition to the report document, the Extended Report also gives you access to LipotypeZoom, an interactive tool to curate and download your data, as well as create and export custom graphs. You can select which samples and lipids to include in your analysis, choose between different data plots, analyse lipid features like for example total number of double bonds, and much more.
Features
- Extended lipid class composition profile and extended PCA
- (sub-)species, double bond, chain length and hydroxylation profiles for each lipid class
- Triglyceride fatty acid profile (optional)


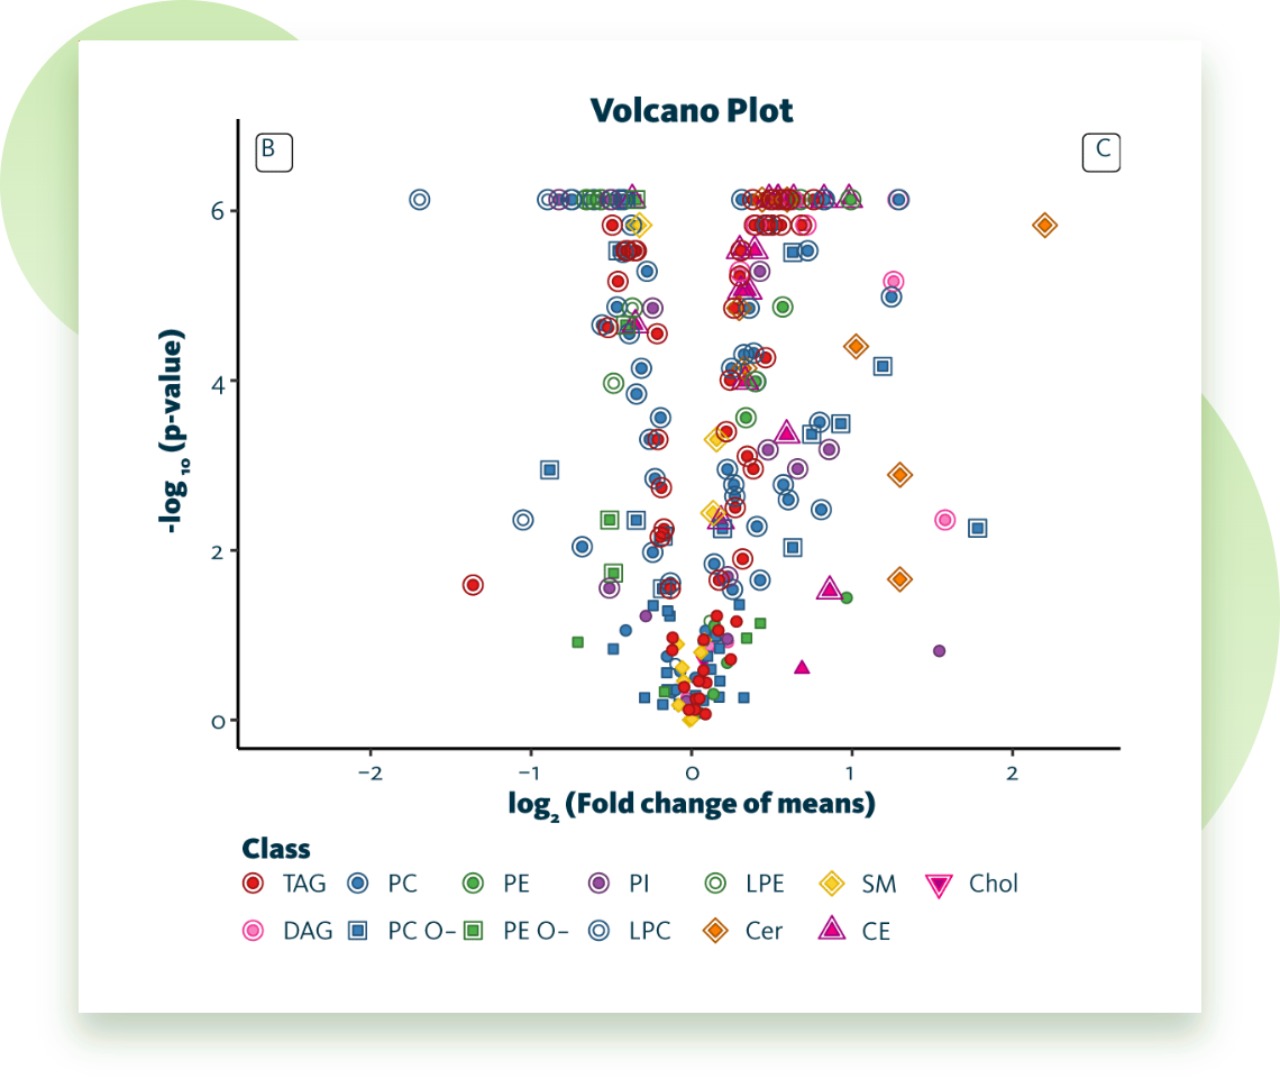
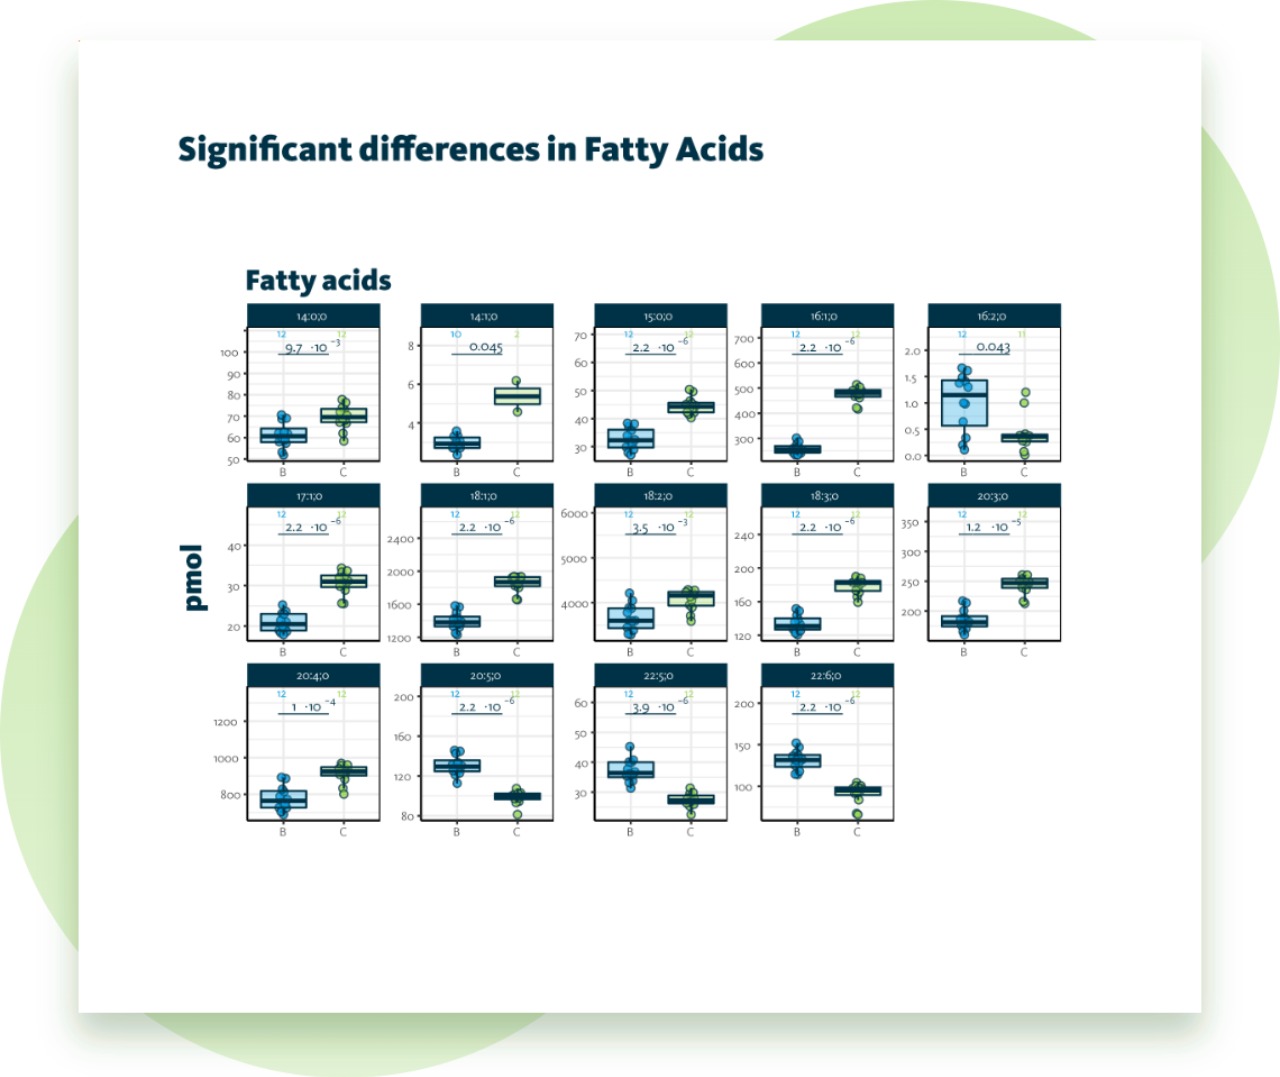
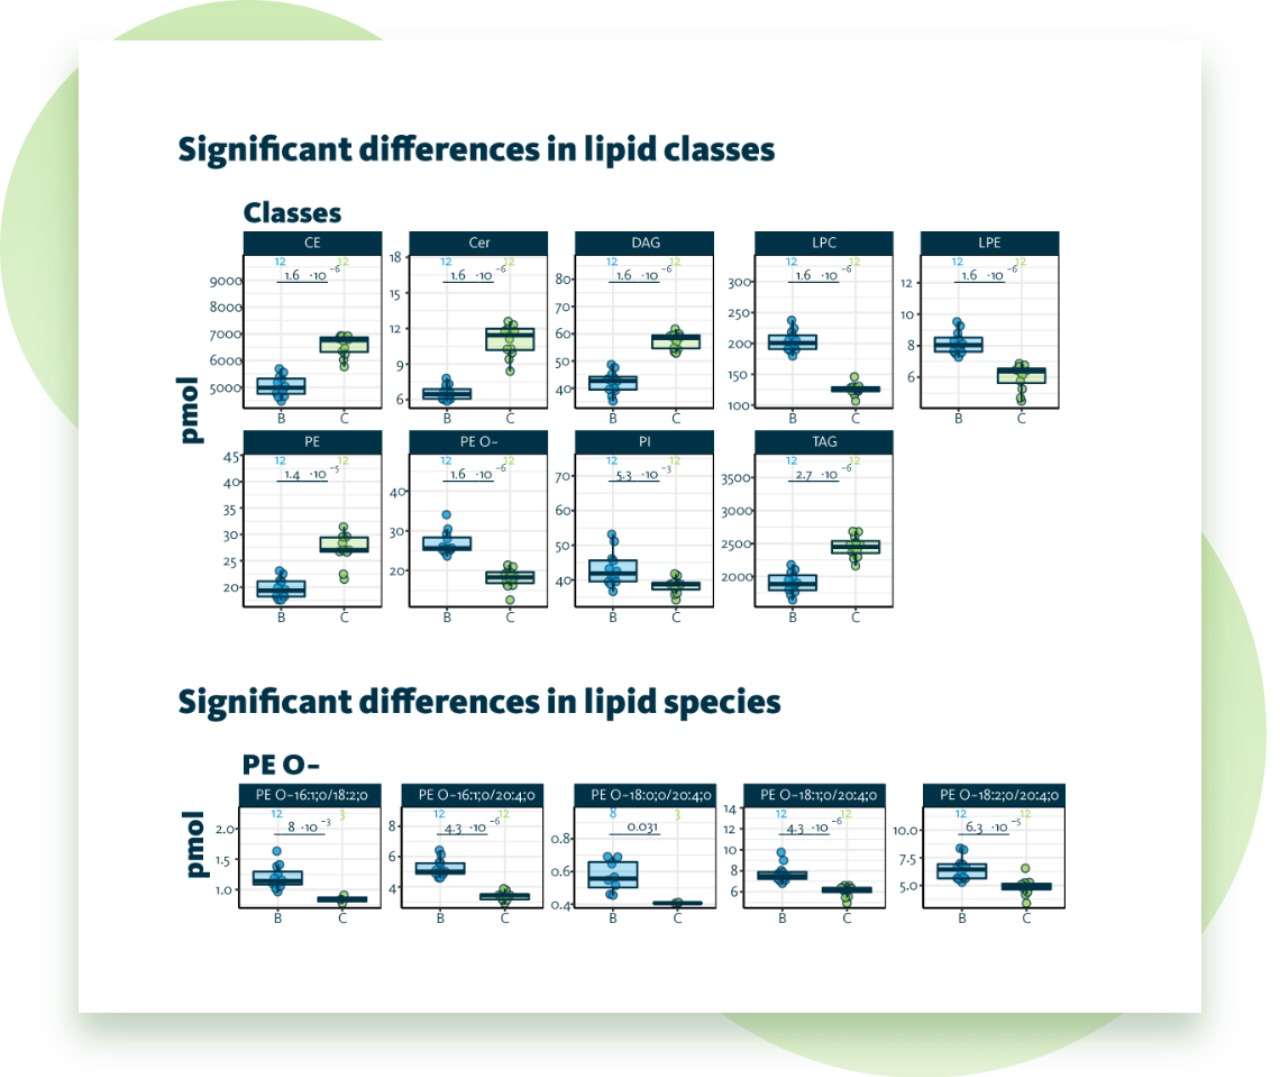
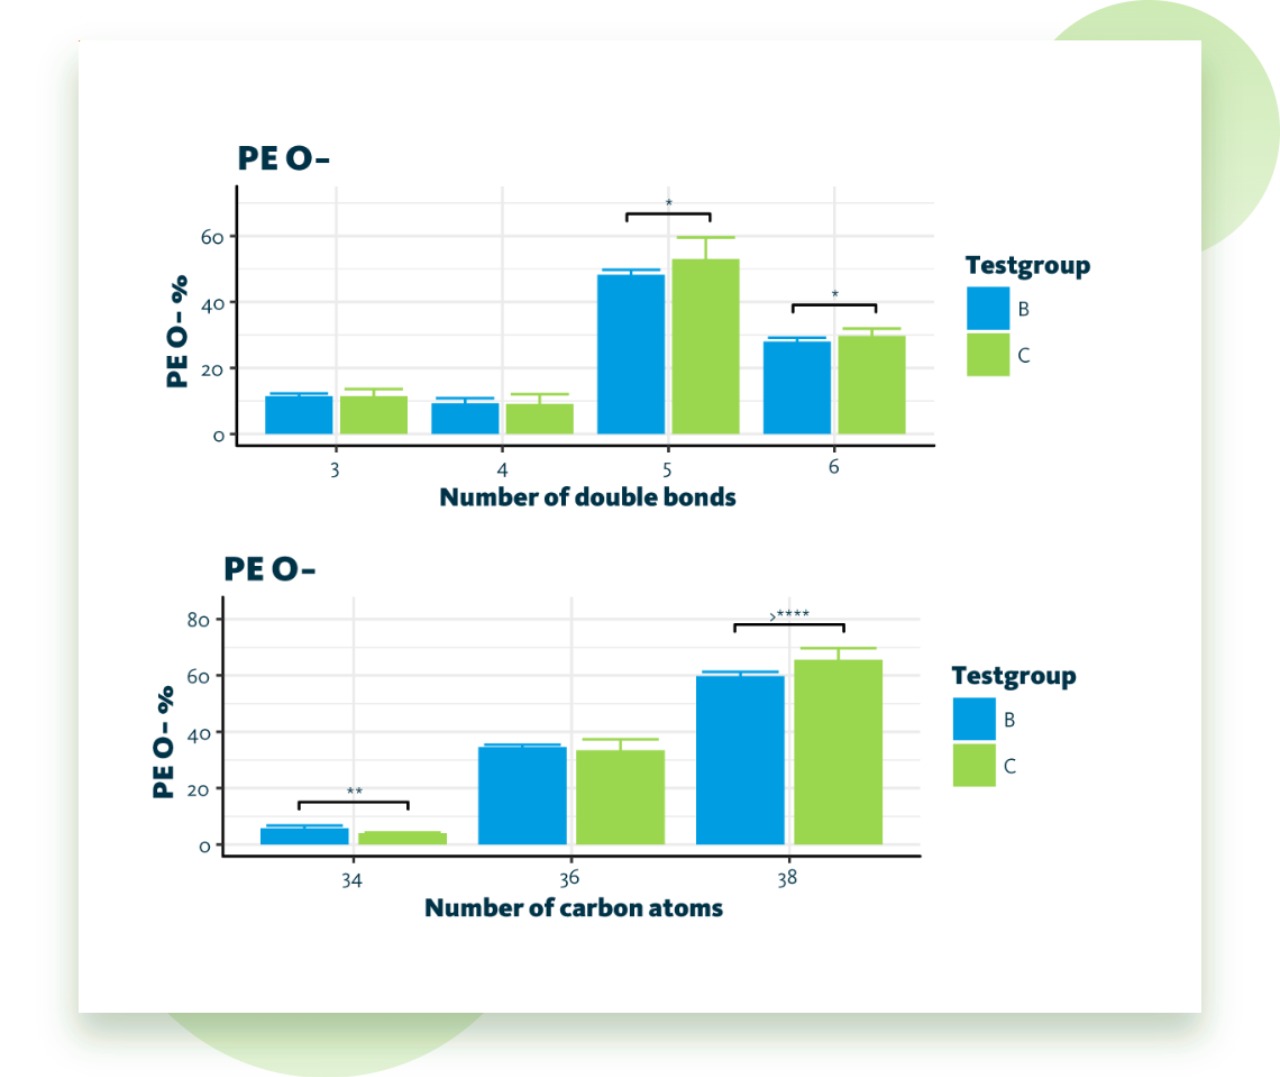
Statistical Report
Level 3 – Finding Answers
The Statistical Data Report is an additional report and contains custom statistical tests to answer your questions. We take the lipidomics data analysis work off your shoulders.
For the Statistical Data Report, the lipidomics data analysis group and the R&D group team up. They combine their expertise in lipid biology and lipidomics data analysis to identify and verify differences and patterns in your lipidomics results.
Features
- Correlation analysis, incl. correlations of lipid (sub-)species, lipid classes, and fatty acids, as well as univariate analysis
- Cohort comparison, incl. comparisons of lipid (sub-)species, lipid classes, fatty acids, and lipid features, as well as univariate analysis
- Feature enrichment and pathway enrichment analysis (optional)


Even More Answers
Use this contact form to inquire lipid analysis or ask questions about Lipotype Lipidomics!
Cutting Edge Research
Visit our Lipidomics Resource Center to study how scientists used their lipidomics data to get their research published.