
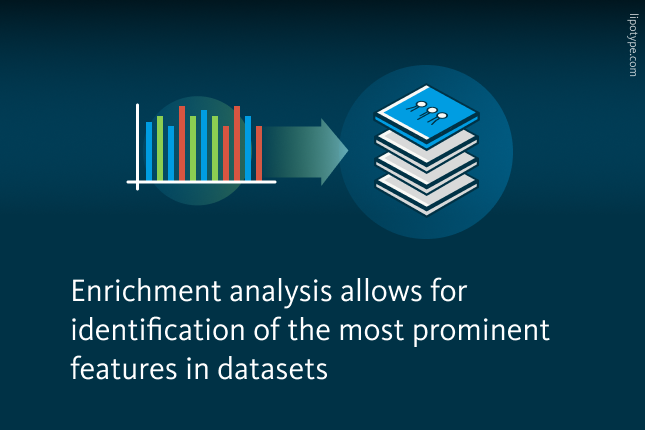
ENRICHMENT analysis is a computational technique designed to pinpoint the presence of over-represented features among statistically significant lipids. Its primary purpose is to guide researchers in selecting the most promising avenues to reach their research objectives. Essentially, enrichment analysis is a way to figure out if something is “extra special” within a bigger group.
Imagine a school with 100 students, and we’re curious about whether being tall is extra common among the basketball players. Out of the entire student body, 33 students are tall. Now, when we look at the basketball team, we see that 7 out of the 8 players are tall. Enrichment analysis helps us determine if this concentration of tall students on the basketball team is significant or just a random occurrence. If the analysis tells us that it’s very unlikely to happen by chance, we can conclude that the basketball team is indeed enriched with tall students. In other words, being tall seems to be an important factor for making it onto the team. It’s a way of quantifying and confirming what we might suspect just by looking at the numbers.

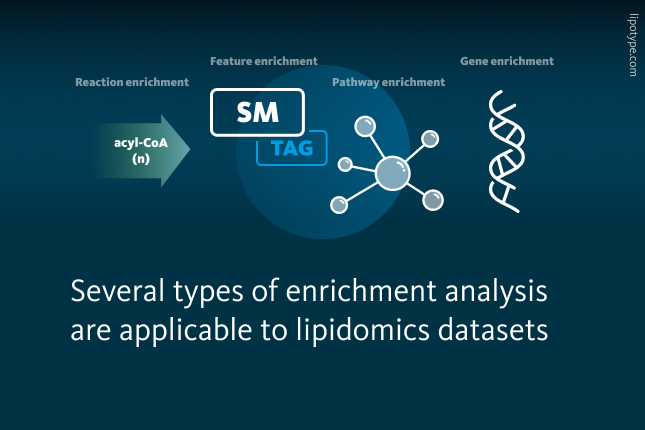
In lipidomics datasets, the “extra special” features fall into one of the following categories:
Feature Enrichment. This analysis focuses on features directly related to lipids, including lipid class, the number of carbon atoms in a lipid, or its number of double bonds.
Pathway Enrichment. Pathway enrichment analysis identifies overrepresented biological pathways within a set of lipids, shedding light on the associated cellular processes and functions related to specific biological phenomena or diseases. Databases commonly used for this purpose include the Kyoto Encyclopedia of Genes and Genomes (KEGG) or WikiPathways. However, many of these pathways are described at the lipid class level and not at the lipid species level, which is often not sufficient for detailed analysis.
Reaction Enrichment. Going beyond pathways, reaction enrichment analysis delves into chemical reactions sourced from databases such as Rhea, identifying reactions that are overrepresented in a set of lipids. A variant of this enrichment is to focus on enzymes or enzyme classes associated with these reactions.
Gene Enrichment. Many researchers including Lipotype scientists have conducted Genome-Wide Association Studies (GWAS) and Phenome-Wide Association Studies (PHEWAS) on human plasma samples. These analyses reveal potential connections between plasma lipids and Single Nucleotide Polymorphisms (SNPs), along with their likely associated gene products that can be used for enrichment analysis.

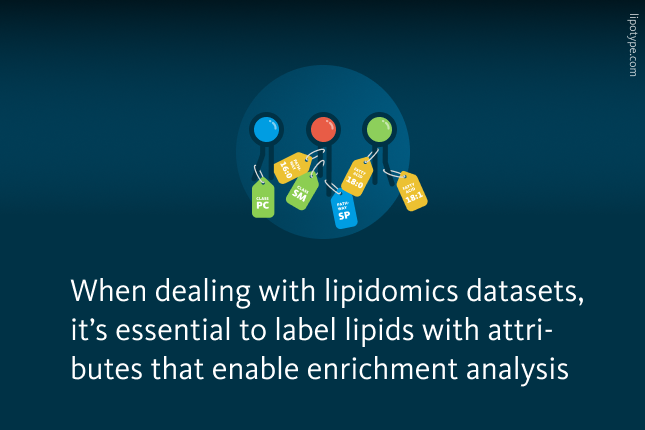
To conduct enrichment analysis within a lipidomic framework, it’s essential to label lipids with specific attributes that enable enrichment. Just as students can be categorized as “tall,” lipids need classification, such as belonging to a particular lipid class, for example, phosphatidylcholine (PC). It is important to note that lipidomics datasets have to be prepared for the enrichment analysis. For example, some datasets may need imputation.
In a lipidomics context, one example could be a scenario involving a sphingomyelin synthase (SGMS1) knockout cell line. The overall analysis included an overrepresentation analysis using a Fisher exact test, focusing on the significant lipid species exclusive to the control samples.

Volcano plot depicting the contrast between control cells and a SGMS1 knockout cell line. Lipids selected for foreground enrichment analysis are color-coded for emphasis.
Upon conducting feature enrichment analysis, several enriched lipid features were identified, such as the lipid class lysophosphatidylethanolamine (LPE) and fatty acids of length C14. However, what stands out most prominently is a significant enrichment of the lipid class sphingomyelin (SM), which aligns with expectations in the context of a sphingomyelin synthase knockout experimental setting.

Feature enrichment. Results are based on the volcano plot.
In addition to feature enrichment analysis, the pathway enrichment analysis was conducted, aiming to identify relevant biological pathways. Notably, this analysis revealed significant enrichment in the sphingolipid metabolism pathway, which aligns with the expectations in the context of a sphingomyelin synthase knockout experimental setting.

Pathway enrichment. Results are based on the volcano plot.
In this example, the outcome is clear, as a known genetic alteration was investigated. However, in research settings where the result is unknown or when complex biological data is being explored, enrichment analysis serves as a valuable tool. It provides hints and direction for further investigation by identifying overrepresented elements within a dataset, such as genes, pathways, or features. This can be especially helpful in uncovering potential underlying causes or pathways that might be contributing to a specific condition or phenomenon. Enrichment analysis can also be done using as input the results of the WGCNA or OPLS-DA, i.e. you do the enrichment on the significant lipid modules identified WGCNA, or on the most important lipids identified by OPLS-DA. Enrichment analysis essentially acts as a compass, guiding researchers toward areas of interest and allowing them to focus their efforts on exploring the most promising avenues in their research.
Lipotype Lipidomics technology provides a powerful solution for customers seeking insights into lipid metabolism in health and pathology.
Do our methods apply to your samples?
Let’s figure that out!

Lipotype products are provided for Research Use Only. They are not intended for clinical diagnostic purposes and must not be used to inform medical treatment decisions. The content of this article is for scientific and educational purposes only and should not be considered medical advice.