Home   Data Analysis 

How to Make Sense of Lipidomics Data?

The Lipidomics Webinar | Mathias Gerl

The amount and complexity of lipidomics data sets can be intimidating initially - but this does not need to be the case.

Watch this episode

This session of “The Lipidomics Webinar” aired on February 24, 2022 . Watch the recording here!

YouTube

By loading the video, you agree to YouTube's privacy policy.
Learn more

Load video

The title image of the Lipidomics Webinar "Exploring Skin Lipidomics & Ceramide Analysis for Skin Research" with Veronika Piskovatska. Our next live webinar
Lipidomics & Ceramide Analysis for Skin Research
Thursday, October 26, 2023

Topic

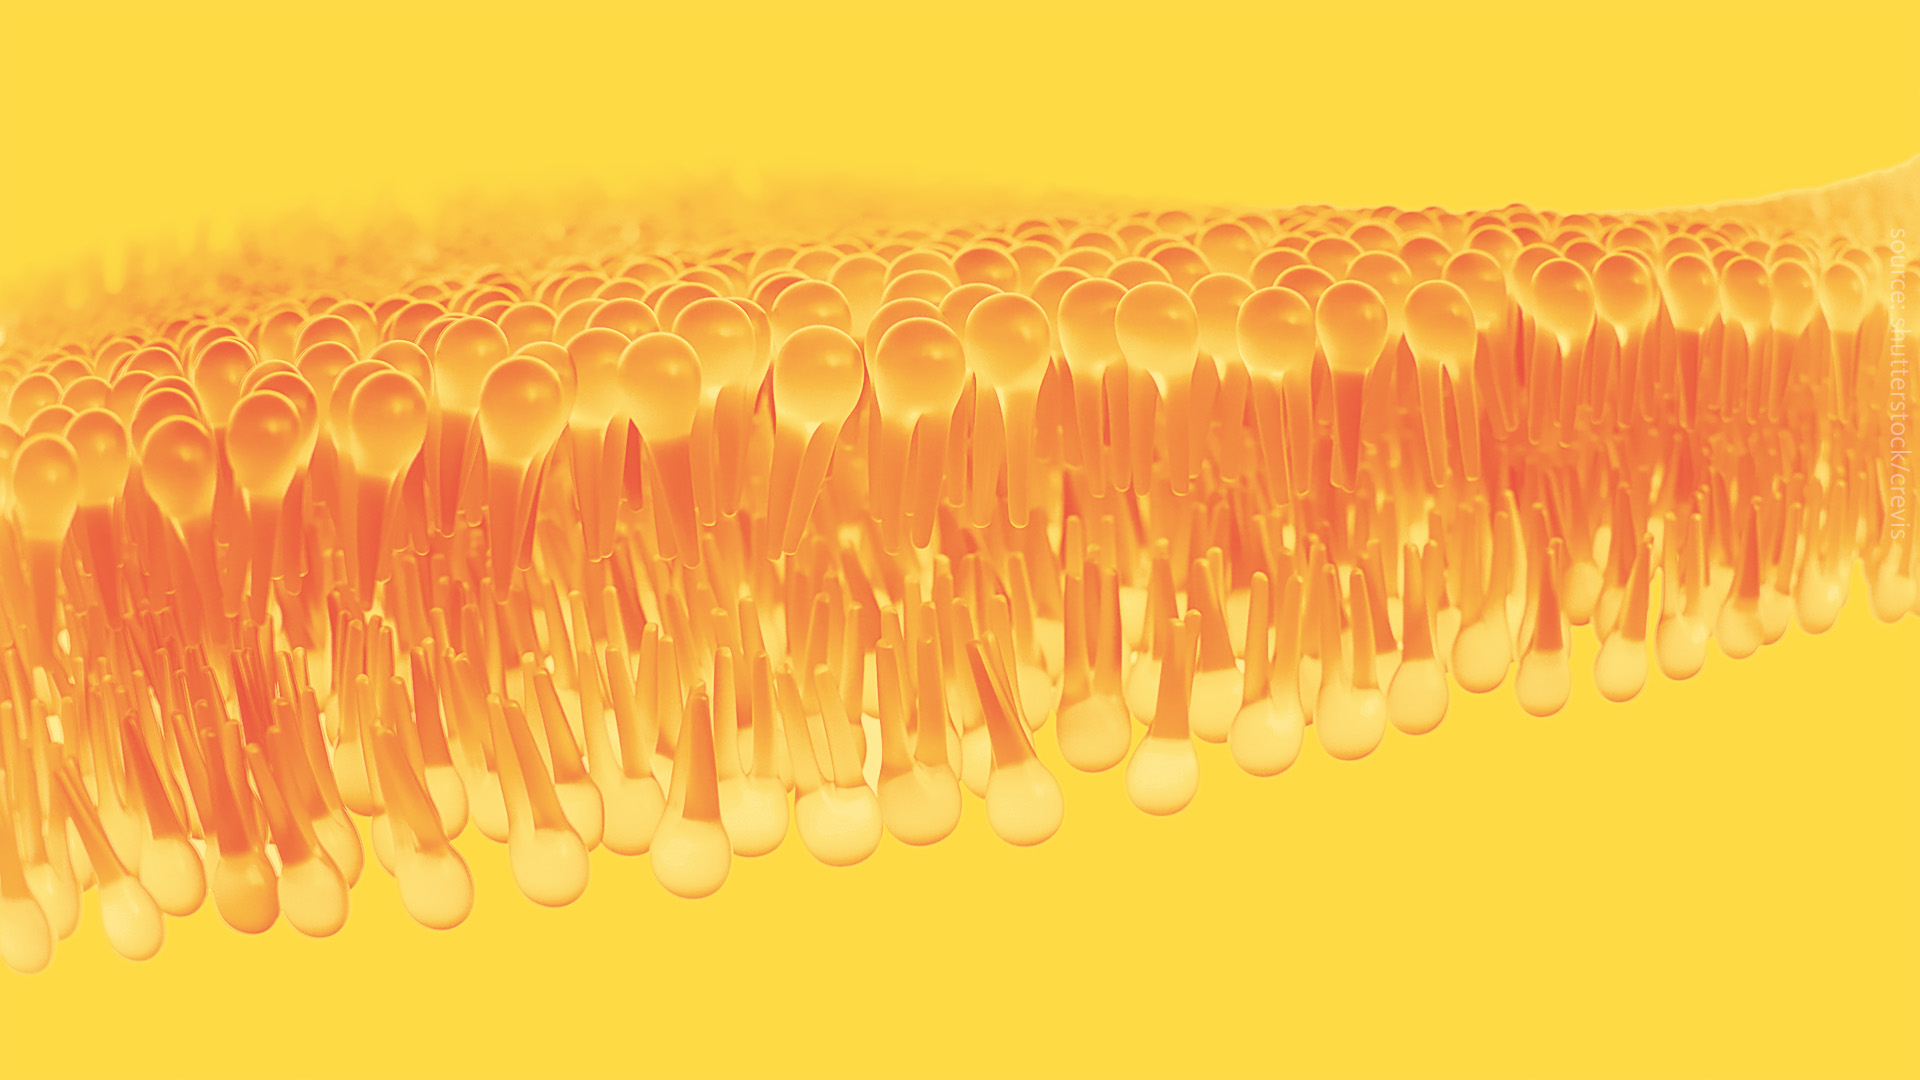
Lipidomics provide unprecedented phenotypic details by accumulating large amounts of data. While these are potentially of great value, the amount and complexity of the data can be intimidating initially.

This webinar is designed to show the basics of lipidomics analysis. It will cover the characteristics of the datasets, e.g. their lipid substructure and multicollinearity, and how to deal with them. We will go through data preparation, how to calculate new features and how to use principal component analysis as a first impression. Then we will focus on univariate and correlation analysis combined with enrichment analysis.

Here is what you can learn

• General properties of lipidomics datasets
• Data cleaning and generation of new features
• How to perform univariate analysis
• What is enrichment analysis and how is it applied

Need more info?

media@lipotype.com

Your Hosts

Dr. Mathias Gerl, Head of Data Analysis & Statistics of Lipotype, Speaker at The Lipidomics Webinar "How to make sense of lipidomics data?"

Dr. Mathias Gerl
Head of Data Science at Lipotype

After receiving his PhD on lipidomics, Dr. Mathias Gerl investigated protein-lipid interactions. In his role as Head of Data Science, Mathias is passionate about finding meaning in large datasets.