

ACCORDING to the International Diabetes Federation (IDF), a person is considered to have metabolic syndrome if they meet three or more of the following five criteria: a large waistline (cutoff varies depending on ethnic background), high triglyceride lipid levels, low levels of “good” HDL cholesterol, high blood pressure, and high fasting blood sugar. Metabolic syndrome is not a single disease but a combination of health problems that tend to occur together.
Worldwide, metabolic syndrome affects between 12% and 31% of people, with the highest rates reported in the Eastern Mediterranean region and the Americas. Over the years, doctors have used different names for this condition, such as syndrome X, insulin resistance syndrome, and even the deadly quartet.

Carrying excess weight is one of the strongest drivers of metabolic syndrome. Studies show that while only about five percent of people with a healthy weight are affected, the number climbs to more than sixty percent among those with obesity. Even small weight increases over time can make a difference. At the same time, weight alone does not tell the whole story. Some people who appear slim still develop metabolic problems, a condition sometimes described as being “metabolically obese normal weight.”
Other factors also play a role in the development of metabolic syndrome. Age, ethnicity, and menopause can raise the risk, as can lifestyle factors such as smoking, lack of physical activity, and diets rich in refined carbohydrates or sugary drinks. Socio-economic conditions, including limited access to healthy foods or healthcare, may contribute as well. In some cases, medications or inherited genetic traits add to a person’s vulnerability to metabolic syndrome.

From the perspective of lipid metabolism, metabolic syndrome develops when the body can no longer store excess energy safely. Under normal conditions, excess calories are stored in subcutaneous fat, the layer beneath the skin. When adipocytes (fat cells) become too large or the tissue is affected by inflammation or scarring, storage capacity runs out. The overflow of lipids then shifts into other organs such as the liver, muscles, and pancreas.
These misplaced, or ectopic, lipids disrupt how these organs respond to insulin. In skeletal muscle, they damage the uptake of glucose, driving insulin resistance. In adipose tissue, insulin resistance reduces insulin’s ability to suppress lipolysis, thereby increasing free fatty acid (FFA) flux to the liver. The liver, flooded with these fatty acids, increases its own glucose production, makes more lipids, and releases larger amounts of very low-density lipoproteins (VLDL), which contribute to unhealthy cholesterol levels. When lipids build up in the pancreas, it damages the insulin-producing β-cells through toxic effects. Over time, this weakens blood sugar control, leading first to glucose intolerance and eventually to the development of type 2 diabetes (T2D).

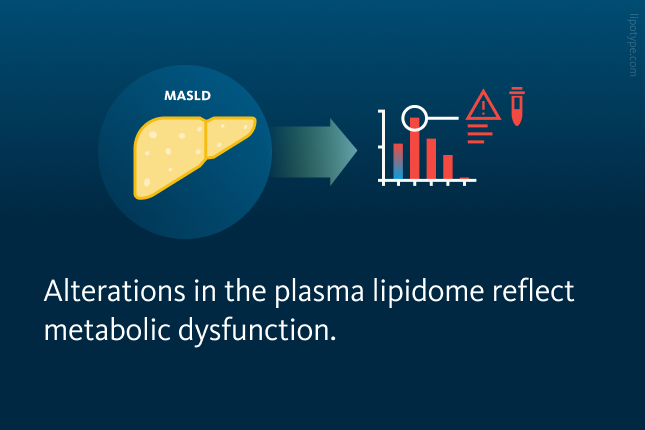
In metabolic syndrome, excess fat in the liver – as seen in metabolic dysfunction-associated steatotic liver disease (MASLD) – triggers mitochondrial damage, oxidative stress, and inflammation, leading to liver cell injury and scarring. Inflamed fat tissue further worsens insulin resistance, while chronically high insulin levels raise blood pressure by affecting the kidneys, nervous system, and blood vessels. Together, this cycle of lipid overflow and insulin resistance forms the basis of metabolic syndrome and explains its strong link to diabetes and heart disease.
While not immediately life-threatening, metabolic syndrome greatly increases the risk of chronic conditions such as type 2 diabetes, cardiovascular disease, and liver disorders. It is also associated with kidney disease, polycystic ovary syndrome, sleep apnea, gout, and even cognitive decline. Because of these wide-ranging effects, the diagnosis is an important warning sign, offering a chance for timely lifestyle changes to prevent serious complications.

Metabolic syndrome itself is highly variable, with different patterns and outcomes across individuals. It greatly increases the risk of serious conditions, especially cardiovascular disease, the leading cause of death worldwide. To better predict and prevent these outcomes, healthcare needs to move beyond broad measures like BMI toward more precise, individualized assessments. One promising tool is lipidomics, which maps detailed lipid profiles in the body. This approach allows earlier detection of metabolic syndrome, tracking of disease progression, and more personalized treatment strategies.
Clinical indicators of metabolic obesity
Obesity develops when the body stores too much lipids, and it is strongly linked to conditions such as metabolic syndrome, cardiovascular disease, type 2 diabetes, and kidney complications. More than 650 million adults worldwide are affected, and the numbers continue to rise so quickly that many experts now refer to obesity as a global pandemic.
Clinicians typically diagnose obesity using measures that estimate body fat. The most common is body mass index (BMI), a calculation based on weight and height. Waist circumference and waist-to-hip ratio (or waist-hip ratio) are also simple tools, while body fat percentage offers more detail by estimating fat distribution through bioelectrical measurements. However, these indicators have clear limitations. They often overlook variations related to age, sex, and ethnicity, and with the exception of body fat percentage, which is harder to assess, they provide little insight into where fat is stored in the body. Importantly, they also cannot reliably distinguish fat from lean muscle, even though only excess fat drives obesity-related health risks.

Studies indicate that molecular measures of metabolism, such as plasma cholesterol or broader metabolomic profiles, may classify obesity more accurately than traditional metrics. Lipid profiles, in particular, have shown potential to detect, predict, and stratify patients for conditions like cardiovascular disease, diabetes, and even multiple sclerosis. A collaborative study involving Lipotype, Lund University in Malmö, and the Finnish Institute for Health and Welfare in Helsinki applied shotgun lipidomics and machine learning to analyze blood plasma from two large population cohorts.
The researchers first characterized the plasma lipidome of 1,061 samples from the 2012 National FINRISK Study using shotgun mass spectrometry. This lipidomics data was used to train machine learning models to estimate obesity indicators, which were then validated on a second dataset of 250 samples from the 2014 Malmö Diet and Cancer Cardiovascular Cohort. Among four standard obesity measures, the model most accurately predicted body fat percentage, followed by waist-to-hip ratio and waist circumference, while BMI estimates were less precise. These findings suggest that plasma lipid profiles reflect fat distribution in the body more reliably than BMI and correlate more closely with obesity-related health risks.
 and their 95% confidence intervals for each sex (male and female) and adjusted for subject age are shown for lipid subspecies. Correlations with p < 0.05 are shown with filled points, whereas correlations with p > 0.05 are shown transparently. Significant differences between male and female correlations are indicated by an asterisk (*).")
Correlation of lipid subspecies with body fat percentage: Spearman correlation coefficients (ρ) and their 95% confidence intervals for each sex (male and female) and adjusted for subject age are shown for lipid subspecies. Correlations with p < 0.05 are shown with filled points, whereas correlations with p > 0.05 are shown transparently. Significant differences between male and female correlations are indicated by asterisks.
Gerl et al., PBio (2019), doi: 10.1371/journal.pbio.3000443
Several triglyceride (TAG) lipid species showed a positive correlation with body fat percentage, while ether phospholipids, including ether-linked phosphatidylcholines, showed opposite trends. The findings also reinforced earlier evidence highlighting the important role of sphingomyelins in obesity.
Although obesity rates continue to rise, current clinical markers used to define or diagnose the metabolic syndrome and associated diseases lack precision. Because metabolic processes are profoundly altered in individuals with obesity, they may serve as more accurate indicators. These metabolic alterations can be detected using molecular omics technologies such as lipidomics, which provide detailed insights into lipid composition. Continued investigation will help clarify the specific molecular mechanisms linking metabolism and obesity.
Lipid profiles of individuals with obesity
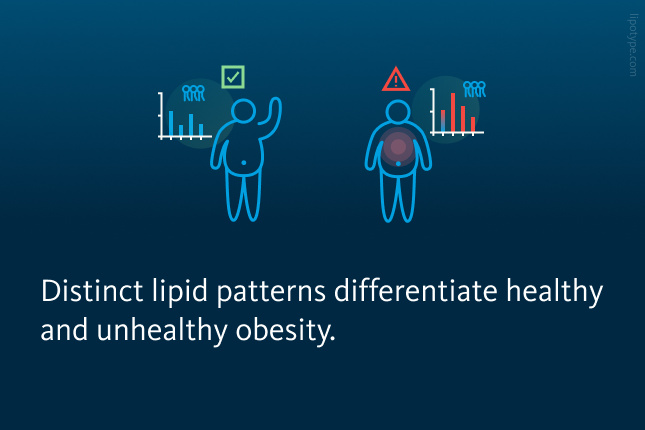
Some individuals with obesity do not develop the typical metabolic complications linked to excess body weight. This condition, referred to as metabolically healthy obesity (MHO), has generated significant discussion about the diverse biological and environmental factors that influence how obesity affects overall health. As obesity continues to be recognized as a global health challenge, understanding MHO is essential for developing more tailored and effective management strategies for people living with obesity.
In this context, Korduner and Ottoson set out to identify metabolic and lipid biomarkers that distinguish metabolically healthy from unhealthy obesity. They conducted a multi-omics analysis of human blood plasma, integrating metabolomics, lipidomics, and proteomics to compare plasma metabolites, lipids, and circulating proteins among individuals with MHO, those with MUO, and non-obese controls (NOC).
 were obtained from plasma samples, and data were analyzed using Principal Component Analysis (PCA), Logistic regression models and correlation tests.")
Study design. 3,443 individuals were classified into 3 categories based on their weight and health history. Profiles for three biomarkers (metabolites, lipids, and proteins) were obtained from plasma samples, and data were analyzed using Principal Component Analysis (PCA), logistic regression models and correlation tests
Korduner et al., Hindawi Journal of Obesity (2021), 10.1155/2021/6616983
This population-based study included 3,443 participants from the Malmö Diet and Cancer Study (MDCS), which investigates carotid artery disease. Of these, 143 individuals were classified as having metabolically healthy obesity (defined by a BMI ≥ 30 kg/m² and no prior hospitalizations) while 273 individuals were categorized as metabolically unhealthy obese based on at least one hospitalization record. The remaining 3,027 participants served as non-obese controls. Blood plasma lipid profiling was performed using a high-throughput shotgun lipidomics.
Biomarker data were analyzed using principal component analysis (PCA) to identify lipid and protein patterns associated with MHO. The second lipid component (PL2) and the fifth protein component (PP5) were linked to MHO compared with MUO. PL2 was mainly driven by sphingomyelins and ether-linked phosphatidylcholines (positive contributions) and by triacylglycerols and diacylglycerols (negative contributions). PL2 also correlated with cardiometabolic markers, showing inverse associations with triglycerides, glucose, and insulin resistance, and a positive correlation with HDL cholesterol.
 represent the contribution of each lipid to the principal component (PL2), showing the lipids that account the most for the differences between the lipid profiles of MHO and MUO. On the left are the Lipid identifiers. PC: Phosphatidylcholine, TAG: Triacylglycerol, SM: Sphingomyelin, DAG: Diacylglycerol.")
Main loadings for PL2, when comparing MHO with MUO. Loadings (bars) represent the contribution of each lipid to the principal component (PL2), showing the lipids that account the most for the differences between the lipid profiles of MHO and MUO. On the left are the Lipid identifiers. PC: Phosphatidylcholine, TAG: Triacylglycerol, SM: Sphingomyelin, DAG: Diacylglycerol.
Korduner et al., Hindawi Journal of Obesity (2021), 10.1155/2021/6616983
Using a metabolic syndrome model that included blood pressure, waist circumference, and fasting levels of glucose, cholesterol, and triglycerides, the researchers compared PL2 and PP5 between the MHO and MUO groups. No significant differences were found, and both groups showed similar metabolic features: higher blood pressure, waist circumference, glucose, and triglycerides, along with lower HDL cholesterol. This suggests that metabolic syndrome may partly explain the overlap between healthy and unhealthy obesity. Further PCA analysis revealed that the metabolic profile of MHO individuals was more similar to MUO than to NOC. The PL2 component, mainly influenced by triacylglycerols and phosphatidylcholine ethers, showed the strongest distinction and may serve as a potential marker of metabolic health.
Overall, MHO individuals displayed a more favorable metabolic profile than MUO, with lower glucose, triglycerides, and lipid and protein biomarkers. Yet, compared with NOC, they still exhibited signs of metabolic strain, including elevated blood pressure, triglycerides, and reduced HDL cholesterol. This multi-omics approach highlights lipid and protein signatures that could improve early detection and personalized treatment of metabolic diseases.
Multiomics in cardiovascular disease research
Cardiovascular disease risk is influenced by multiple factors, including metabolic syndrome, other metabolic disorders, genetic predisposition, diet, and physical inactivity. Common clinical markers such as cholesterol, triglycerides, and lipoproteins are often used to estimate an individual’s CVD risk, as many cardiovascular and inflammatory conditions are reflected in the plasma lipidome. However, a more detailed analysis of lipid profiles, particularly when integrated with other omics data, could enhance disease prediction and guide more effective, personalized treatments.
A multi-omics study explored the relationships between genetic variants, the plasma lipidome, and CVD risk. Using data from 2,181 participants in the EUFAM and FINRISK biobanks, researchers performed genotyping and plasma lipidomics, followed by comprehensive association analyses. The study identified approximately 9.3 million genetic markers, 141 lipid species across 13 lipid classes, and numerous significant links between specific genotypes and lipid species. These findings show that plasma lipid concentrations are partly heritable and can serve as valuable predictors of both cardiovascular disease and diabetes risk.

The analyses revealed that single-nucleotide polymorphisms (SNPs) – common inherited genetic variations – were linked to the presence of specific plasma lipid species. Among these, ceramides and lipids containing polyunsaturated fatty acids showed the highest heritability, whereas phosphatidylinositols showed the opposite trend.
Further genome-wide association studies (GWAS) identified 2,817 links between 518 genetic variants and 42 lipid species, confirming previous findings and revealing new ones. To understand their connection to cardiovascular diseases, researchers compared these lipid-associated variants with 25 CVD-related phenotypes from the FinnGEN and UK Biobank datasets. Ten variants were found to overlap with CVD traits. Lipidomics-based associations have been shown to be stronger predictors of cardiovascular outcomes compared to traditional plasma lipid parameters.

Relationship between lipid-associated variants and cardiovascular diseases: Shown are selected associations of the identified genetic variants (SNPs) with the strongest associated lipid (species), and the relationship between the identified variants with cardiovascular disease phenotypes as odds ratios. Highlighted in red color are associations significant at FDR <0.05.
Rubina Tabassum et al., Nature Communications (2019), doi: 10.1038/s41467-019-11954-8
By combining lipidomics with other omics approaches, the researchers identified new links between genetic variants, plasma lipid species, and CVD phenotypes. This study demonstrated that plasma lipid levels are heritable and that these traits are closely connected to cardiovascular disease risk. The resulting multi-omics database, integrating genetic, lipidomic, and phenotypic data from population cohorts, represents a valuable foundation for future population health research.
Lipidomics risk scores in diabetes and cardiovascular disease
Early and precise identification of individuals at high risk for metabolic syndrome, type 2 diabetes, and cardiovascular disease (CVD) is essential for timely prevention and intervention. Detecting risk factors early allows for lifestyle adjustments and closer medical monitoring, reducing disease burden and improving overall health outcomes. To enhance predictive accuracy, Lauber and Simons proposed combining genetic background, lipidomic profiles, and clinical risk factors, offering a more comprehensive assessment than traditional models.

Study design. Genomic and lipidomic analyses of blood plasma samples from 4067 participants were performed. The risk of type 2 diabetes and cardiovascular disease development was assessed based on the data obtained from blood plasma analysis and clinical and vital parameters of participants.
Lauber et al., PLOS Biology (2022), 10.1371/journal.pbio.3001561
In their study, the authors examined how the blood plasma lipidome influences the future development of T2D and CVD. Using shotgun lipidomics and advanced data analysis tools, they identified and quantified 184 lipid species, from which a lipidomics risk score (L) was developed. The results revealed a clear trend – higher lipidomics risk scores correlated with a greater incidence of both T2D and CVD. When combined with clinical (C), polygenic (P), and demographic (N) factors, this integrated model (N + L + P + C) significantly improved risk stratification. In the highest quartile, the case rates reached 51% for T2D and 53% for CVD, compared to only 1% and 6.5% in the lowest quartile. These findings demonstrate that lipidomic profiling, particularly when integrated with other omic and clinical data, can substantially improve early disease prediction and personalized risk assessment.
 and CVD (right) case rates are allocated to deciles. Dot represents the mean for 10 repetitions and the bars represent the standard errors. The risk scores are based on the models utilizing the following parameters: age and sex (N), lipidome (L), polygenic score (P), and clinical parameters (C). The combinations of particular variables in the models are N+L+P and N+L+P+C. The dashed line represents the average incidence rate within the cohort. CVD, cardiovascular disease; T2D, type 2 diabetes.")
Risk scores and case rate correlation. Various risk scores for T2D (left) and CVD (right) case rates are allocated to deciles. Dot represents the mean for 10 repetitions and the bars represent the standard errors. The risk scores are based on the models utilizing the following parameters: age and sex (N), lipidome (L), polygenic score (P), and clinical parameters (C). The combinations of particular variables in the models are N+L+P and N+L+P+C. The dashed line represents the average incidence rate within the cohort. CVD, cardiovascular disease; T2D, type 2 diabetes.
Lauber et al., PLOS Biology (2022), 10.1371/journal.pbio.3001561
The authors performed clustering analysis on the lipidomics data, identifying six distinct subgroups with varying risk score distributions. Notably, the subgroup with the highest risk for both CVD and T2S exhibited a unique lipidomic signature, despite having similar vital and clinical parameters to other groups. This high-risk cluster showed significant alterations in nine lipid classes, including cholesterol and specific lysolipids, while other lipids like regular and ether-linked phosphatidylcholines, DAG, and TAG remained unchanged.
These findings emphasize the potential of lipidomic profiling for early disease risk prediction and personalized monitoring of metabolic health and metabolic syndrome development. Regular measurement of the lipidome could provide information about how lifestyle and diet affect individual health over time. By detecting lipidomic changes early, interventions could be tailored to prevent or slow disease progression.
Lipid profiles of cardiovascular & inflammatory diseases
Lipids play a crucial role in regulating inflammation, chronic inflammatory disorders, such as metabolic syndrome, cardiovascular disease (CVD), and autoimmune conditions. Therefore, lipids are expected to produce distinct lipidomic signatures in such disorders and can be detected through lipidomics analysis.
To explore this, Matthiesen and Vieira examined blood plasma lipidome profiles in individuals with CVD, ischemic stroke (IS), and systemic lupus erythematosus (SLE). Using shotgun lipidomics, they analyzed blood plasma from a cohort of 427 participants, including age-matched healthy controls, identifying and quantifying 596 lipid species. The study aimed to determine whether lipidomic profiles differ among various CVD and IS subtypes and how these patterns compare to those observed in SLE, another disease characterized by chronic inflammation.
 group, 21 to the ischemic stroke (IS) group, and 104 to the systemic lupus erythematosus (SLE) group. Sample acquisition was followed by shotgun mass spectrometry lipidomics analysis of obtained samples, lipid identification and quantification, and data analysis.")
The study design overview: Total of 427 patients participated in the study, with 85 belonging to the control group, 217 to the cardiovascular disease (CVD) group, 21 to the ischemic stroke (IS) group, and 104 to the systemic lupus erythematosus (SLE) group. Sample acquisition was followed by shotgun mass spectrometry lipidomics analysis of obtained samples, lipid identification and quantification, and data analysis.
Matthiesen et al., EBioMedicine 70 (2021) 103504, 10.1016/j.ebiom.2021.103504
The dataset was analyzed using a combination of machine learning approaches. In unsupervised analysis, principal component analysis (PCA) revealed clear distinctions between age-matched controls and several cardiovascular disease subgroups (CVD1–CVD5) as well as ischemic stroke (IS) patients. While CVD3 showed minimal separation from controls, CVD4 and CVD5 displayed near-complete separation, suggesting that lipid abundance patterns are strongly correlated with disease presence.
Further analyses explored lipid profile associations across CVD, IS, and systemic lupus erythematosus (SLE). Venn diagram comparisons of significantly up- or downregulated lipids showed substantial overlap among these conditions. The heatmap indicated consistent trends: cholesteryl esters were commonly upregulated, whereas phosphatidylcholines and triacylglycerols were largely downregulated. These shared lipidomic alterations suggest overlapping metabolic and inflammatory mechanisms among cardiovascular and autoimmune diseases.

Significantly regulated lipids within various groups of diseases: A Venn diagram depicting significantly regulated lipids between CVD subgroups. B Heatmap visualizing the direction of significantly upregulated and downregulated lipids in different disease groups and in CVD subgroups.
Matthiesen et al., EBioMedicine 70 (2021) 103504, 10.1016/j.ebiom.2021.103504
A supervised machine learning approach was applied to the lipidomic dataset, incorporating information on each participant’s classification into cardiovascular disease (CVD), ischemic stroke (IS), or systemic lupus erythematosus (SLE) groups. Results from principal component analysis (PCA) and linear discriminant analysis (LDA) supported the development of partial least squares (PLS) classifiers, which were trained and tested on independent datasets. The classifiers demonstrated strong predictive performance, achieving high sensitivity, specificity, and accuracy for differentiating CVD, IS, and SLE from controls. Separation between CVD subgroups also exceeded 0.80, underscoring the discriminative power of lipid profiles.
Overall, the findings highlight mass spectrometry-based plasma lipidomics as a powerful tool for the differential diagnosis of metabolic syndrome and atherosclerosis-related vascular diseases, including CVD and IS. Beyond diagnosis, plasma lipidome profiling also holds potential for risk prediction of cardiovascular and metabolic diseases such as diabetes, supporting its growing role in precision medicine.
How can lipidomics help in metabolic syndrome research?
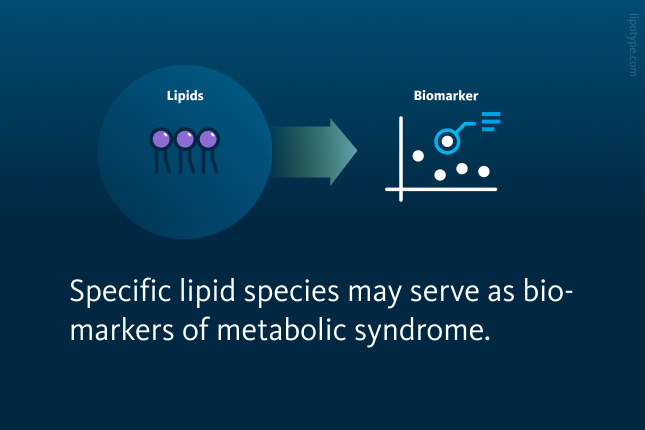
Lipidomics analysis helps advance metabolic syndrome research by revealing detailed changes in lipid composition and metabolism that traditional clinical markers may miss. By profiling hundreds of lipid species, lipidomics can identify biomarkers of metabolic dysfunction, clarify the molecular links between obesity, insulin resistance, and cardiovascular risk, and enable early detection and precise disease classification. This systems-level approach supports personalized prevention and treatment strategies for metabolic syndrome and related disorders.

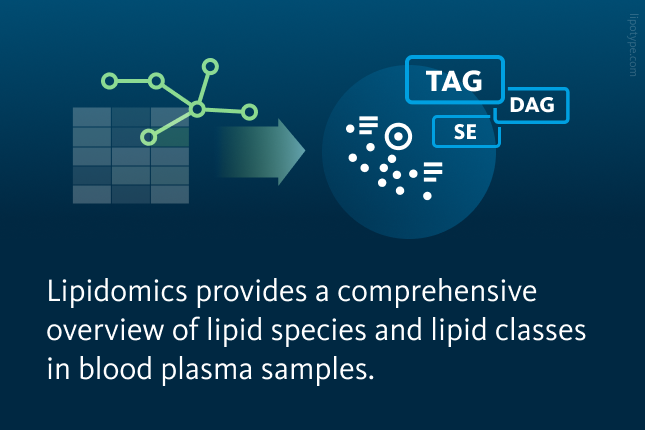
Lipotype lipidomics technology allows for detailed analysis of lipid composition in blood samples, including whole blood, serum, and plasma, providing insight into how specific lipids reflect changes in whole body lipid metabolism. This supports the discovery of disease biomarkers, therapeutic targets, and lipid-based drug delivery strategies.
Need clarity on the process?
Ask us anything!

Lipotype products are provided for Research Use Only. They are not intended for clinical diagnostic purposes and must not be used to inform medical treatment decisions. The content of this article is for scientific and educational purposes only and should not be considered medical advice.