Lipid profiles of adipose tissue, muscle, and liver and glucose blood level in fasting mice.
About the author
Olga (Olya) Vvedenskaya
Sci. Communications Officer
Dr. Dr. Olya Vvedenskaya studied medicine, and further obtained her PhD in the field of molecular oncology. She loves to deliver scientific messages in a clear and accessible manner.
• Glycemia is the glucose level in the blood
• Glycemia influences glucose-stimulated insulin secretion (GSIS) from pancreatic β-cells
• GSIS is affected by fasting and insulin resistance
Olga (Olya) Vvedenskaya
Sci. Communications Officer
Dr. Dr. Olya Vvedenskaya studied medicine, and further obtained her PhD in the field of molecular oncology. She loves to deliver scientific messages in a clear and accessible manner.
WHITE adipose tissue (in this article: adipose tissue), skeletal muscle (in this article: muscle), and liver maintain metabolic balance in the body. During fasting, the liver produces glucose through glycogen breakdown (glycogenolysis) and glucose synthesis (gluconeogenesis) to supply energy to tissues. Simultaneously, adipocytes (the cells of adipose tissue) release free fatty acids and glycerol via lipolysis. These fatty acids fuel the heart and muscles, while glycerol supports the liver in producing glucose through gluconeogenesis.
After eating, nutrients from food trigger insulin release from the pancreas. Insulin reduces lipid breakdown and liver glucose production while increasing glucose uptake into muscles and adipocytes. Most of the glucose from meals is stored in muscles as glycogen, with a smaller portion entering adipocytes. In adipocytes, glucose is converted into glycerol 3-phosphate to further form triglycerides. The liver also takes up glucose during meals, driven by insulin and glucose levels in the blood. Additionally, products of glycolysis (like lactate, amino acids, and glycerol) are used by the liver to produce lipids (via de novo lipogenesis) or glycogen indirectly through gluconeogenesis. For healthy individuals, insulin effectively stops glycogen breakdown in the liver, though it only partially reduces gluconeogenesis.
The balance between glucose-dependent insulin release from pancreatic β-cells (called glucose-stimulated insulin secretion (GSIS)) and its action on muscle, liver, and adipose tissue is crucial for maintaining blood glucose levels (glycemia). GSIS is initiated by the Glut2-glucokinase (Gck)-KATP channel pathway, which triggers membrane depolarization, leading to calcium (Ca2+) entry and Ca2+-dependent insulin release. This process is influenced by glucose and various additional factors, such as amino acids and free fatty acids, hormones, neurotransmitters, and signals from immune cells and adipocytes, including chemokines and cytokines. Additionally, insulin secretion is shaped by interactions between β-cells and the extracellular matrix (ECM) as well as neighboring cells.
Insulin action begins when it binds to its receptor (Insr), triggering the recruitment of insulin receptor substrates (Irs) and activation of two major pathways: Pi3k/Akt or Ras/Raf/Map kinase. In muscle and adipose tissue, the Pi3k/Akt pathway promotes glucose uptake. Glucose can be stored as glycogen or triglycerides (TAGs) or used in glycolysis, the Krebs cycle, and the OXPHOS pathway to generate ATP for muscle contraction. In adipocytes, glucose is mainly converted into glycerol 3-phosphate, which is used to store free fatty acids as triglycerides. In the liver, glucose enters via Glut2 and is converted to glucose-6-phosphate (G6P) by glucokinase. G6P supports glycogen synthesis or fuels the pentose phosphate pathway and glycolysis to produce NADPH, acetyl-CoA, and ATP.
Insulin signaling can be impaired by several mechanisms, contributing to insulin resistance in conditions like obesity and type 2 diabetes (T2D). Key factors include reduced expression of Insr on the cell surface, phosphorylation of Insr and Irs by Ser/Thr kinases, decreased OXPHOS activity, reduced degradation of branched-chain amino acids (BCAAs), and increased oxidative stress, to name a few. Disruptions in insulin secretion or action often lead to hyperglycemia. For example, deleting genes such as Gck in pancreatic β-cells, Glut4 in muscle, Chrebp in adipose tissue, or Insr in liver cells results in elevated blood glucose levels. These effects are often worsened by a high-fat diet (HFD).
While previous studies have highlighted the roles of specific genes and pathways in regulating glycemia, they have not fully explained how these pathways are coordinated across different tissues to maintain blood glucose balance. The study by Florence Mehl and colleagues aimed to identify tissue-specific pathways regulating fasting glycemia, a marker of glucose homeostasis and diabetes risk. Researchers analyzed soleus muscle, liver, and visceral white adipose tissue in mice with varying genetic backgrounds and sensitivity to high-fat diets under fasting conditions.
Three mouse strains were fed a regular or high-fat diet. Glucose and insulin measurements, and insulin tolerance tests were performed on days 3, 10, and 30, while lipidomics and RNAseq samples were acquired on days 5, 13, and 33. Despite strong transcriptomic changes from HFD, glycemia was minimally affected. A data fusion approach (additionally using the RNAseq data) revealed organ-specific co-expression modules linked to glycemic variation, identifying pathways likely involved in fasting glycemia regulation.
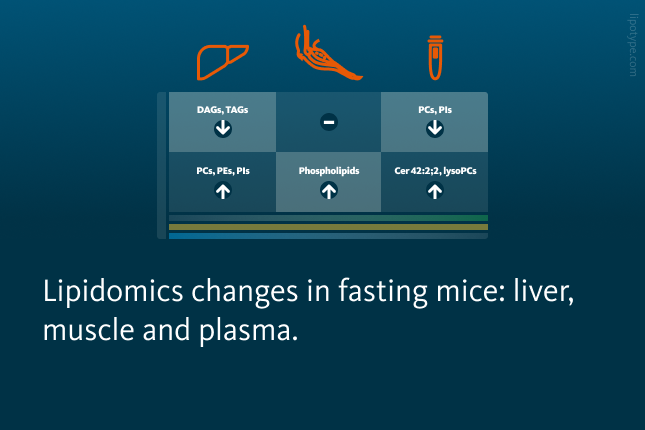
A total of 338 lipids belonging to multiple lipid classes, were quantified in the liver, muscle, adipose tissue, and blood plasma, and their levels were correlated with fasting mice glycemic levels in a heatmap. The liver exhibited the most significant lipid changes, with decreased levels of diacylglycerols (DAGs) and TAGs containing fatty acids of varying lengths and saturation, while phosphatidylcholines (PCs), phosphatidylethanolamines (PEs), and phosphatidylinositols (PIs) were elevated. In muscle, phospholipid levels showed a mild increase. Adipose tissue displayed a rise in particular TAGs (e.g., TAG 46:1 to TAG 50:3) with low molecular weight, and a decline in larger, highly unsaturated TAGs (e.g., TAG 56:3 to TAG 56:8). Plasma lipid changes were more complex, with decreased PCs and PIs, increased ceramide 42:2;2, and elevated lysophosphatidylcholines.
Overall, reduced DAGs and TAGs in the liver and increased short-chain TAGs in adipose tissue were most strongly linked to fasting glycemia.
Lipidomics data across tissues in mice with fasting glycemia. Left panel A heatmap showing the lipid species that are either upregulated or downregulated with glycemia in the specified tissues. Right panel A heatmap showing the individual TAGs in each organ, with relative abundance represented as Z-scores.
Mehl et al., iScience, 27, 11, 111134 (2024), 10.1016/j.isci.2024.111134
This study used transcriptomic and lipidomic analysis to identify pathways co-regulated across soleus muscle, liver, and adipose tissue that contribute to fasting glycemia. In islets (based on non-lipidomics data), steady insulin levels despite elevated glycemia were linked to reduced expression of pathways that enhance glucose-stimulated insulin secretion, such as receptors for interorgan communication, ECM signals, and gap junction proteins. However, the core Glut2-Gck-KATP signaling pathway remained unchanged, emphasizing the β-cell’s role in integrating metabolic, hormonal, and immune signals to modulate insulin secretion. Disruptions in these pathways may lead to hyperglycemia and type 2 diabetes (T2D).
In peripheral tissues, distinct mechanisms of insulin resistance were identified. Muscle showed reduced insulin signaling, glycolysis, and glucose uptake. In the liver, impaired insulin sensitivity was associated with reduced OXPHOS, antioxidant proteins, and BCAA metabolism, alongside heightened immune activity. Adipose tissue displayed increased expression of inflammation-related genes, which may support adipogenesis and insulin sensitivity adjustments. Notably, these changes occurred in non-obese, non-diabetic mice, suggesting a physiological role in glycemic regulation. This study highlights the complex interplay of genetic factors, diet, and interorgan communication in maintaining glucose homeostasis.
This study investigates how various pathways are coordinated across different tissues to regulate fasting glycemia, with control being influenced by both genetics and diet. While glucose homeostasis is often seen as the balance between GSIS and insulin action, a more complete understanding requires considering the interactions of pathways that regulate hormone secretion, tissue responses, and systemic metabolic and inflammatory processes.
Lipotype Lipidomics technology supports studies on cellular differentiation by profiling a wide range of lipid classes and species. Its high-throughput capacity allows rapid, detailed comparisons across multiple samples, which is highly relevant to research in metabolic diseases such as obesity and diabetes.
Related articles
The role of sphingolipids in mitochondrial damage and obesity
Metabolic damage caused by obesity can be limited by targeting a sphingolipid metabolism enzyme.
SIB is an internationally recognized non-profit organization, dedicated to biological and biomedical data science. Its research staff maximizes the impact of scientific projects by making data FAIR (Findable, Accessible, Interoperable and Reusable) and acting as a high-quality partner enabling innovation in academia, hospitals and industry.
Share this story
You are currently viewing a placeholder content from OpenStreetMap. To access the actual content, click the button below. Please note that doing so will share data with third-party providers.


 and glucose synthesis (gluconeogenesis) to supply energy to tissues. Adipocytes release free fatty acids and glycerol via lipolysis. B After eating, nutrients from food trigger insulin release from the pancreas. Insulin reduces lipid breakdown and liver glucose production while increasing glucose uptake into muscles and fat cells. Most of the glucose from meals is stored in muscles as glycogen, with a smaller portion entering fat cells. In adipocytes, glucose is converted into glycerol 3-phosphate to further form triglycerides. The liver also takes up glucose during meals, driven by insulin and glucose levels in the blood.")
 cycle, generating ATP. An increased ATP-to-ADP ratio closes K-ATP channels, causing membrane depolarization and opening voltage-gated calcium (Ca2+) channels. The resulting Ca2+ influx triggers the release of insulin from granules through exocytosis. 2. Prolonged glucose stimulation activates insulin gene transcription in the β-cell nucleus. Newly synthesized insulin is processed and packaged into vesicles, which are then primed for rapid release.")