
Introduction to lipidomics data analysis
HIGH-throughput lipidomics produces data with a specific combination of analytical challenges: structured missingness tied to various reasons, hundreds of correlated species that complicate multiple testing, and group differences that are often subtle relative to within-group biological variations. Choosing the right method for each of these problems and applying them correctly is essential for proper, conclusive lipidomics data analysis and further biological interpretation.
This article brings together lipidomics data analysis methods that address these challenges: imputation, OPLS-DA, enrichment analysis, and WGCNA. In each case, the article addresses the problem the method solves, when to reach for it, and what to watch out for. The goal of this article is to give researchers working with lipidomics data a clearer understanding of the analytical decisions they could make.
Starting clean: imputation of missing values
Mass spectrometry cannot always detect every lipid in every sample. Missing values in lipidomics data arise from multiple sources; these include: true absence of the lipid from the sample, degradation during sample preparation, or signal falling below the instrument’s limit of quantitation (LOQ).

Excluding all lipids with any missing value is one solution, but it throws away a large part of the dataset and biases the analysis toward abundant species. Another approach used in mass spectrometry data analysis is imputation: estimating what the missing values most plausibly are, given the structure of the data.
Not all imputation methods perform equally well on lipidomics data. Lipotype scientists systematically tested multiple approaches and found that most standard methods, including simple mean or median replacement, produce poor results because they ignore the detection-limit structure of the missingness.

Of the imputation strategies evaluated, the k-nearest neighbor truncation method developed by Shah et al. consistently outperformed alternatives. Its key advantage is the use of correlations and the explicit incorporation of distributions for left-censored data (values are known to be below a certain limit, but the exact values are unknown). A complete dataset is more than methodological convenience. Statistical methods become applicable where they previously could not be run, and where they could, the results carry greater confidence.
Seeing the difference in lipidomics dataset: PCA and OPLS-DA
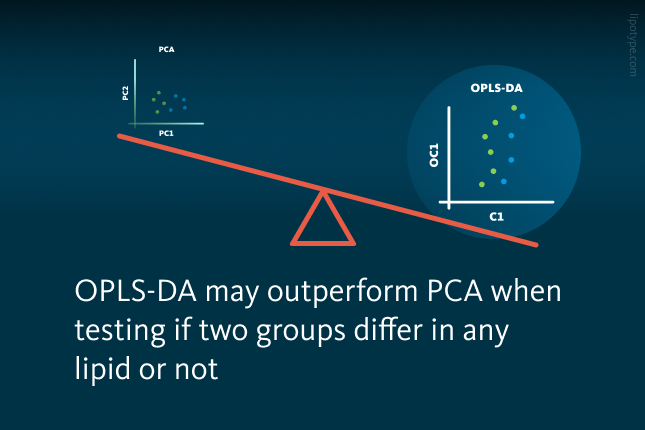
The standard first step in exploring a lipidomics dataset is a principal component analysis (PCA) score plot. PCA is unsupervised, meaning it finds the major axes of variation in the data without any knowledge of which group each sample belongs to. That makes it a good general overview, but in some cases PCA is an inefficient tool for detecting subtle group differences. If the biological signal of interest is smaller than the within-group biological noise, PCA will not be able to show it.
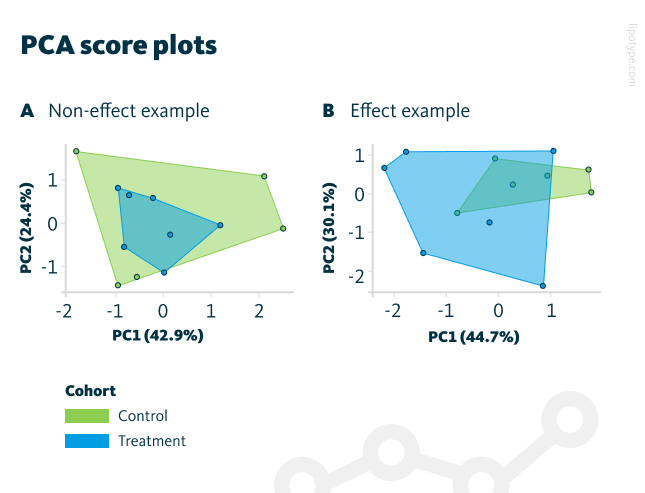
PCA score plots show the first two principal components containing most of the variance. The control and treatment groups for both examples (A and B) overlap.
Orthogonal partial least squares discriminant analysis (OPLS-DA) takes a different approach. It is told which group each sample belongs to (supervised method), and it then finds the projection that best separates those groups, placing group-discriminating variance on the x-axis and within-group variance on the y-axis. This makes even modest lipidome differences more visible.
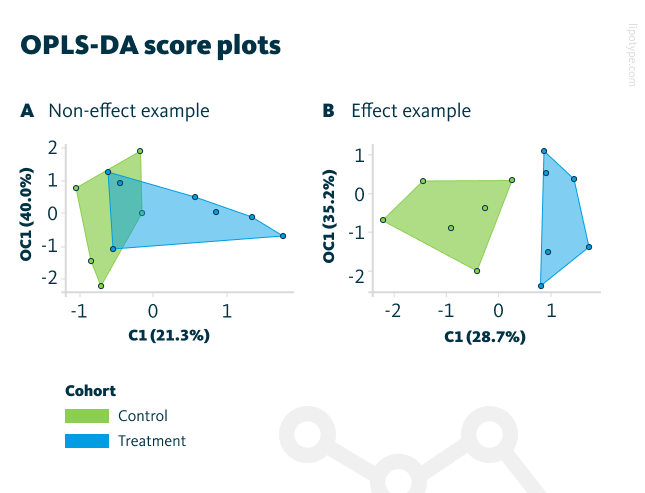
The OPLS-DA score plots show the first two principal components containing most of the variance. A The control and treatment group overlap for the “non-effect example”. B For the “effect example”, the control and treatment group are properly separated.
OPLS-DA does two things at once when comparing two lipidomic conditions: it separates the groups, and it identifies which specific lipids are driving that separation. Because it is a supervised method (meaning it uses the known group labels to find the separation), it is more prone to overfitting. For this reason, a permutation test is recommended to check whether the separation is statistically robust rather than something that happened by chance, and to confirm the model is valid. When group differences are present, OPLS-DA can sometimes reveal patterns that are less apparent in PCA.
Finding the pattern: Enrichment analysis
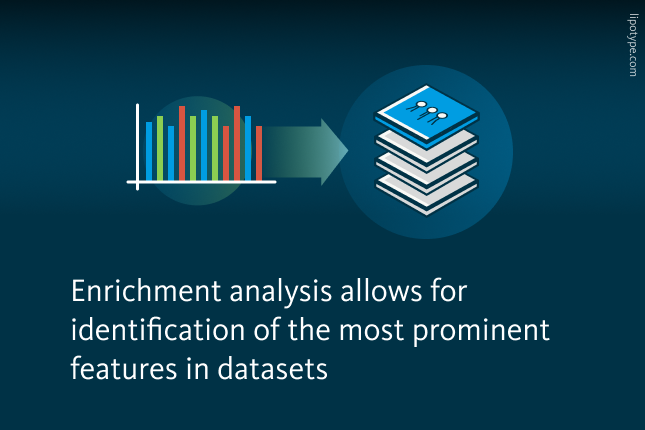
Statistical testing produces a list of significantly changed lipids, potentially dozens or hundreds of species. A long list of significant hits is a starting point, not a conclusion. Enrichment analysis asks the next question: are certain lipid properties systematically overrepresented among the significant species, beyond what chance would predict?
A school of 200 students contains 60 tall students (30%). On the basketball team of 8 players, 7 are above average height (87.5%). Enrichment analysis determines whether this overrepresentation is statistically significant or attributable to chance.

The same principle applies to lipid classes, reactions, pathways, or genomic features in a lipidomics dataset. If 10% of all measured lipids belong to a given class, but 60% of the significant lipids do, that imbalance is unlikely to be random, and enrichment analysis quantifies exactly how unlikely. What emerges is not just a list of changed lipids, but a set of prioritized biological features worth investigating further.

In discovery settings, where the biology is unknown and the lipidomics or other dataset is complex, enrichment analysis is particularly powerful. Rather than leaving the researcher to manually interpret a long hit list, it directs to the underlying biological features and therefore points toward the mechanisms most likely worth pursuing.
It also integrates naturally with the other methods described here. The significant modules from WGCNA and the top-loading lipids from OPLS-DA can both serve as input, making enrichment analysis another point of multiple analytical approaches rather than just one.
Reducing complexity: WGCNA
Testing hundreds and thousands of lipid species individually against an experimental condition means running an enormous number of statistical tests.
Weighted correlation network analysis (WGCNA) sidesteps this problem by working at a different level of abstraction. Rather than testing individual lipids, it first identifies groups of lipids that behave consistently together across samples and then tests whether those modules correlate with an experimental or clinical trait. Hundreds of lipids might condense into five modules. Further analysis and testing of these modules is much more appealing than performing hundreds of tests to start with.

Beyond reducing the statistical burden, module composition is itself informative. A module dominated by a single lipid class, or by lipids sharing a common chain length, suggests a shared regulatory mechanism, helping researchers postulate and further evaluate hypotheses.
WGCNA reduces the analytical complexity of a full lipidomics dataset by grouping co-regulated lipids into modules and testing those modules rather than individual species against a clinical or experimental trait. Modules that show strong correlation become the focus for further investigation.
From statistical analysis to biological meaning
Imputation, OPLS-DA, enrichment analysis, and WGCNA together produce a structured set of statistical outputs: driver lipids, enriched pathways, correlated modules, significance values. These outputs are rigorous and reproducible. They are not, however, a biological interpretation.
Converting statistical results into scientific conclusions requires evaluating the findings within existing literature, distinguishing genuine novelty from expected results, and articulating a plausible biological mechanism. This step demands deep domain expertise, takes considerable time, and does not scale easily to large numbers of datasets.
A modern approach to this problem may include AI-assisted interpretation workflows designed to address this bottleneck. The goal of such tools is not to replace scientific judgment, but to automate pattern recognition and literature search, facilitate the generation of a well-structured interpretation, and allow the expert analyst to improve robustness and focus on findings that genuinely require human insight.

A few things are worth being explicit about. The system should not generate hypotheses beyond what the data and the supplied literature support. It should not validate or re-run statistical analyses. And the scientist review step is not optional. The AI is a component of the workflow, not the expertise itself. AI-generated material should always be presented as a draft for expert evaluation, not as a finished conclusion.
LLMs can generate plausible interpretations, but they do not necessarily produce scientifically valid ones. Expert added value comes from performing rigorous statistical analysis adapted to lipidomics, using a controlled framework to guide the AI model, and, crucially, having the lipidomics expertise required to critically evaluate and interpret the resulting hypotheses.
Conclusion
Lipidomics generates data that is rich in biological signal and challenging to analyze. The methods described in this case study (imputation, OPLS-DA, enrichment analysis, and WGCNA) address that challenge. The interpretive layer, connecting statistical outputs to biological conclusions, requires additional work.




Lipotype Lipidomics technology offers broad lipidome coverage with absolute quantification, providing complete, high-confidence datasets that make the analytical methods most powerful.
Need clarity on the process?
Ask us anything!